Standard SaverXware and SaverXware ETC
Each SAVER Field Instrument includes the SaverXware software. This software platform enables communication with the SAVER hardware for pre-recording setup and data analysis once the SAVER has recorded some events. Data analysis functions include drop heights, shocks, vehicle movements and vibrations, as well as temperature and humidity cycles.
Download the software
Measurement setup
Users are provided with simple, standard Setup Gateways for the most common measurement applications. Advanced setup options are also possible which provide complete control over all setup parameters.
Data analysis
SaverXware includes powerful analysis features to evaluate recorded data in the time domain and frequency domain. Summary analysis can be performed on individual or multiple events. Vector Visualizer is a popular software feature that helps explain the direction and intensity of recorded dynamic events.
Event table and history
Multiple data files can be viewed in a common project database. Recorded events are chronologically presented in Event Tables. Quick History is a graphical representation of the recorded events and displays the captured data from beginning to end in one view. Thumbnail images of individual events and summarized data are provided and update automatically when viewing or processing the data differently.
Summary Reporting – See SaverXware ETC options below for advanced analysis and reporting tools
SaverXware will generate user-defined summary reports and export the results. Additionally, it is possible to export the data itself to ASCII files for further analysis and reporting using spreadsheets or other universally available software applications.
SaverXware ETC Analysis and Reporting Features
All the functionality of standard SaverXware, plus:
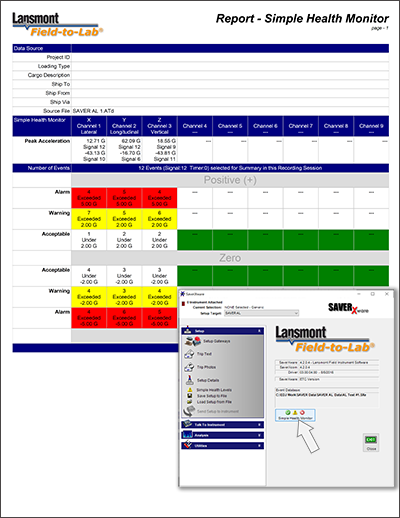
Simple Health Monitoring and Reporting: User-defined Warning and Alarm thresholds for acceleration, temperature and humidity
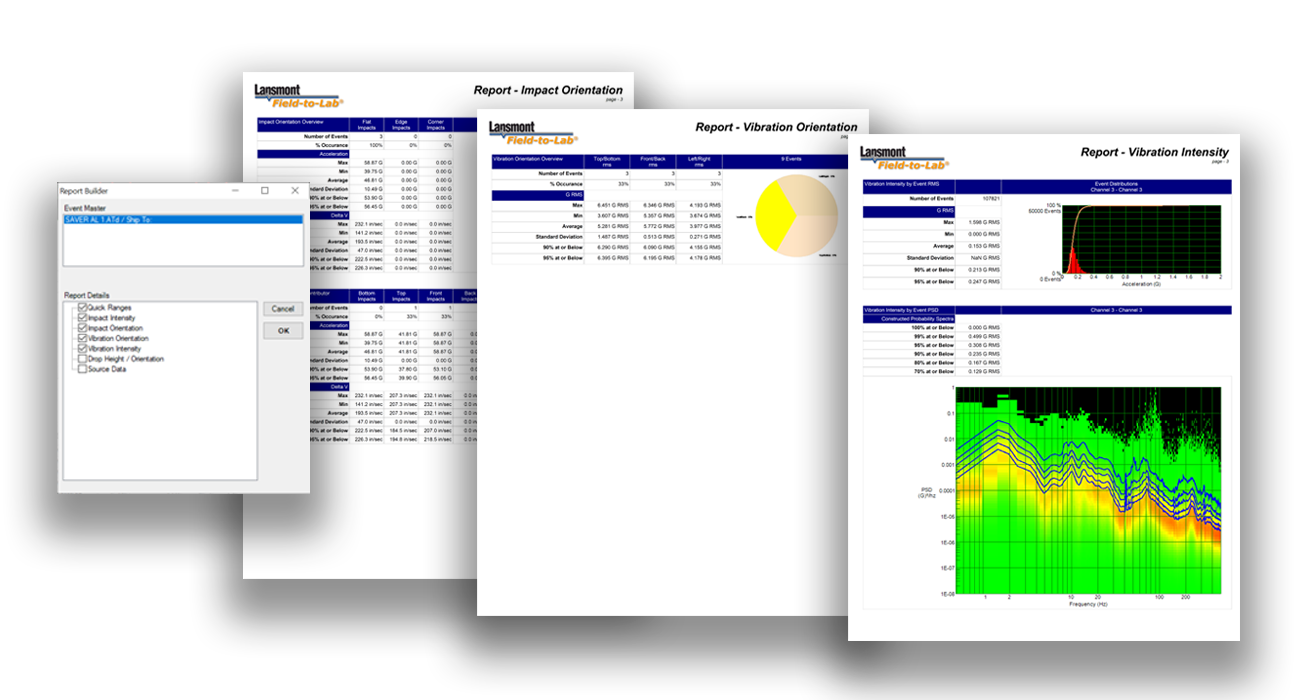
Report Builder: New comprehensive data reporting, performed on an individual, or multiple SXd files simultaneously
- Quick Ranges
- Impact Intensity
- Impact Orientation
- Vibration Orientation
- Vibration Intensity (Constructed Probability)
- Drop Height and Orientation