Mitigating Vibration Input with Engineered Packaging Designs If you need to move products from their point of manufacture to their end-use destinations, you can expect that they’ll be exposed to vibration input during that journey.
Depending on the mode(s) of transport, you can expect vibration input at various amplitudes across a well-defined frequency range (bandwidth). There’s typically very little you can do to avoid, or change that environmental input, thus your options are limited to addressing both the product and its protective packaging.
In fact, we often refer to this simple formula to describe the relationship of the product, package, and distribution environment - Product + Packaging > Environment
A more descriptive version of that formula can be expressed as Product Durability + Protective Packaging > Distribution Environment Hazards.
To truly establish confidence that you’ll be able to move your products safely through the supply chain without compromising quality, you need to understand each part of that formula.
- How durable is my product (fragility assessment)?
- How severe are the hazards in my supply chain?
- Do I need protective packaging to assure no transport-related damage and if so, what kind, how much, placed where?
In Part 3 of this email series, we addressed the Product variable and fragility assessment through vibration resonance search and identification testing. In this Part 4 communication, we’ll provide a real-world example of how that product resonance information was used to design a protective packaging system.
Case Study A company that was designing large, sophisticated equipment for scanning of air cargo was experiencing damage issues when their equipment arrived on-site at the end-user locations. The scanning process involved hardware that rotated around items that were placed inside a tunnel as it performed the scanning – like an MRI system.
The equipment included a bearing system that assured balanced rotation during the scanning. Unfortunately, the company started to log wear (vibration) damage related to the bearing systems upon arrival. To expedite getting these systems into operation and various airport locations, these large systems were initially placed directly on trucks for transport, without any protective packaging. Because of that, all the transport vibration was being transmitted directly from the truck bed into the product during transport.
To address and eliminate the damage issue, the company brought their product to the test lab to perform vibration fragility assessment, while subsequently designing an effective, proven protective packaging solution. Once in the laboratory, the entire product was loaded onto the vibration system and rigidly connected to the tabletop. Subsequently, sinusoidal sweeps were performed between 3 and 200 Hz. The frequency range of the sweep was based upon the range of expected frequency bandwidth input from over-the-road transport.
Response accelerometers (sensors) were placed at various critical locations on the equipment to identify and document critical resonant characteristics.
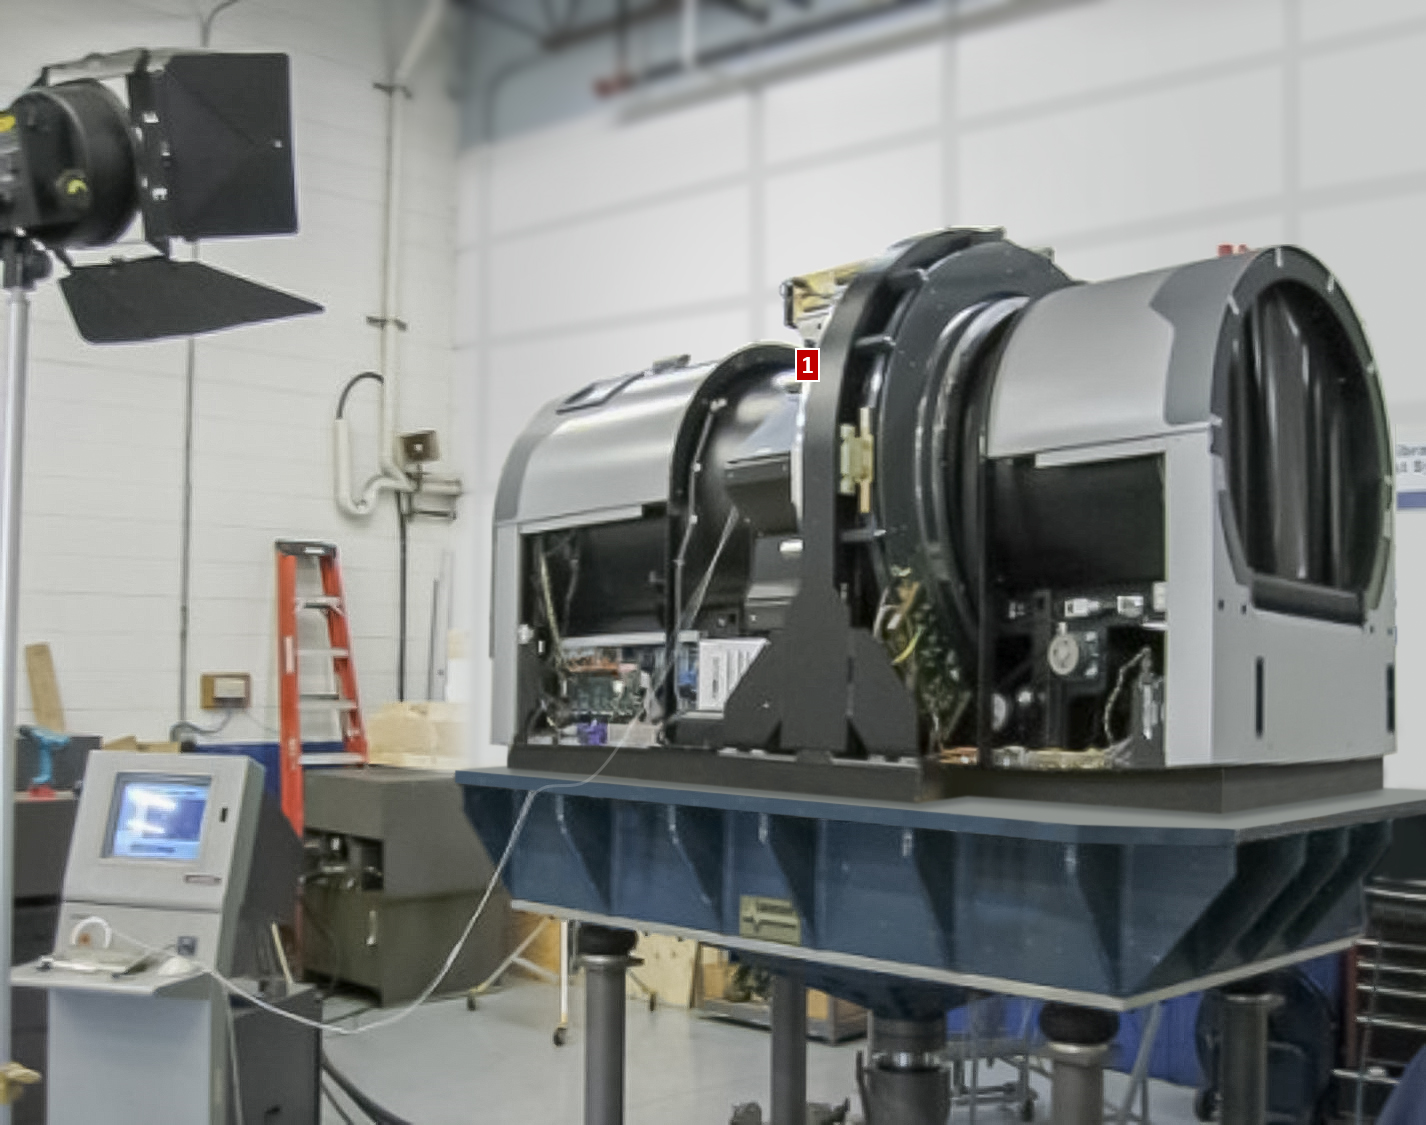
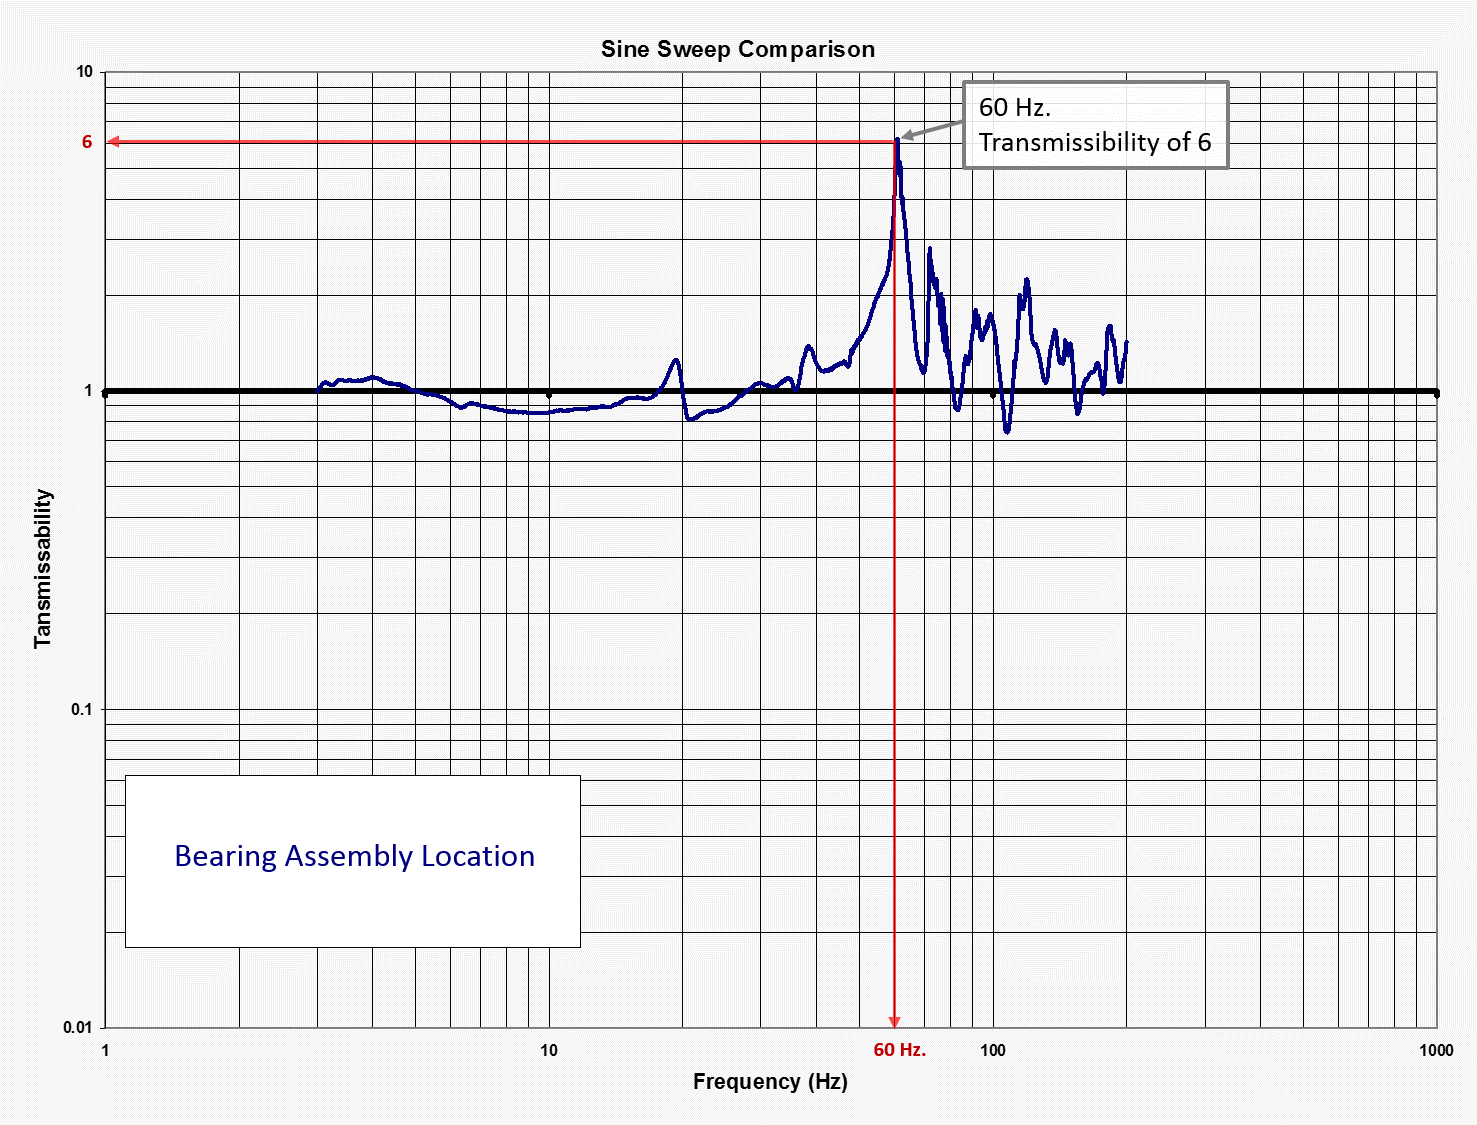
After all sinusoidal sweep testing was performed, it was determined that the bearing assembly [1] possessed the critical natural frequency – which was approximately 60 Hz., with a transmissibility of 6.
That transmissibility level meant that any transport vibration input experienced at 60 Hz. would be amplified by 600%.
With that information identified, the company moved towards developing a cushioning system that would attenuate vibration input at 60 Hz. and above. To do this, you want to create a cushioned system that has its own resonant characteristics equal to, or below half the critical product natural frequency.
After cushioning experiences resonance, it transitions into what is called attenuation, where the material response is less than the input. By targeting a package/cushion resonance of at least half the critical product natural frequency, it helps assure the cushioning is in its attenuation zone out at the product's resonant frequency.
Considering this product’s critical natural frequency of 60 Hz., that meant they needed to develop a cushioning system with a natural frequency of 30 Hz. or below. This is demonstrated more clearly down below. Cushioning material manufacturers typically publish performance specifications that designers can use to facilitate the development of protective package systems.
That specification data is often strategically applied to the design of holistic systems that mechanically filter, or attenuate potentially damaging input vibration, such that it never makes it through the packaging materials, and into the product. That cushioning performance is based upon the material’s static loading – or weight/area.
Changing the material’s static loading will change the resonant characteristics of the material, as well as the complete package system. For this equipment, a cushioned pallet deck was designed, targeting a 30 Hz. or less system natural frequency. That complete system (product on cushioned pallet deck) was then placed on the vibration test system, where the same 3-200 Hz. sinusoidal sweeps were repeated.
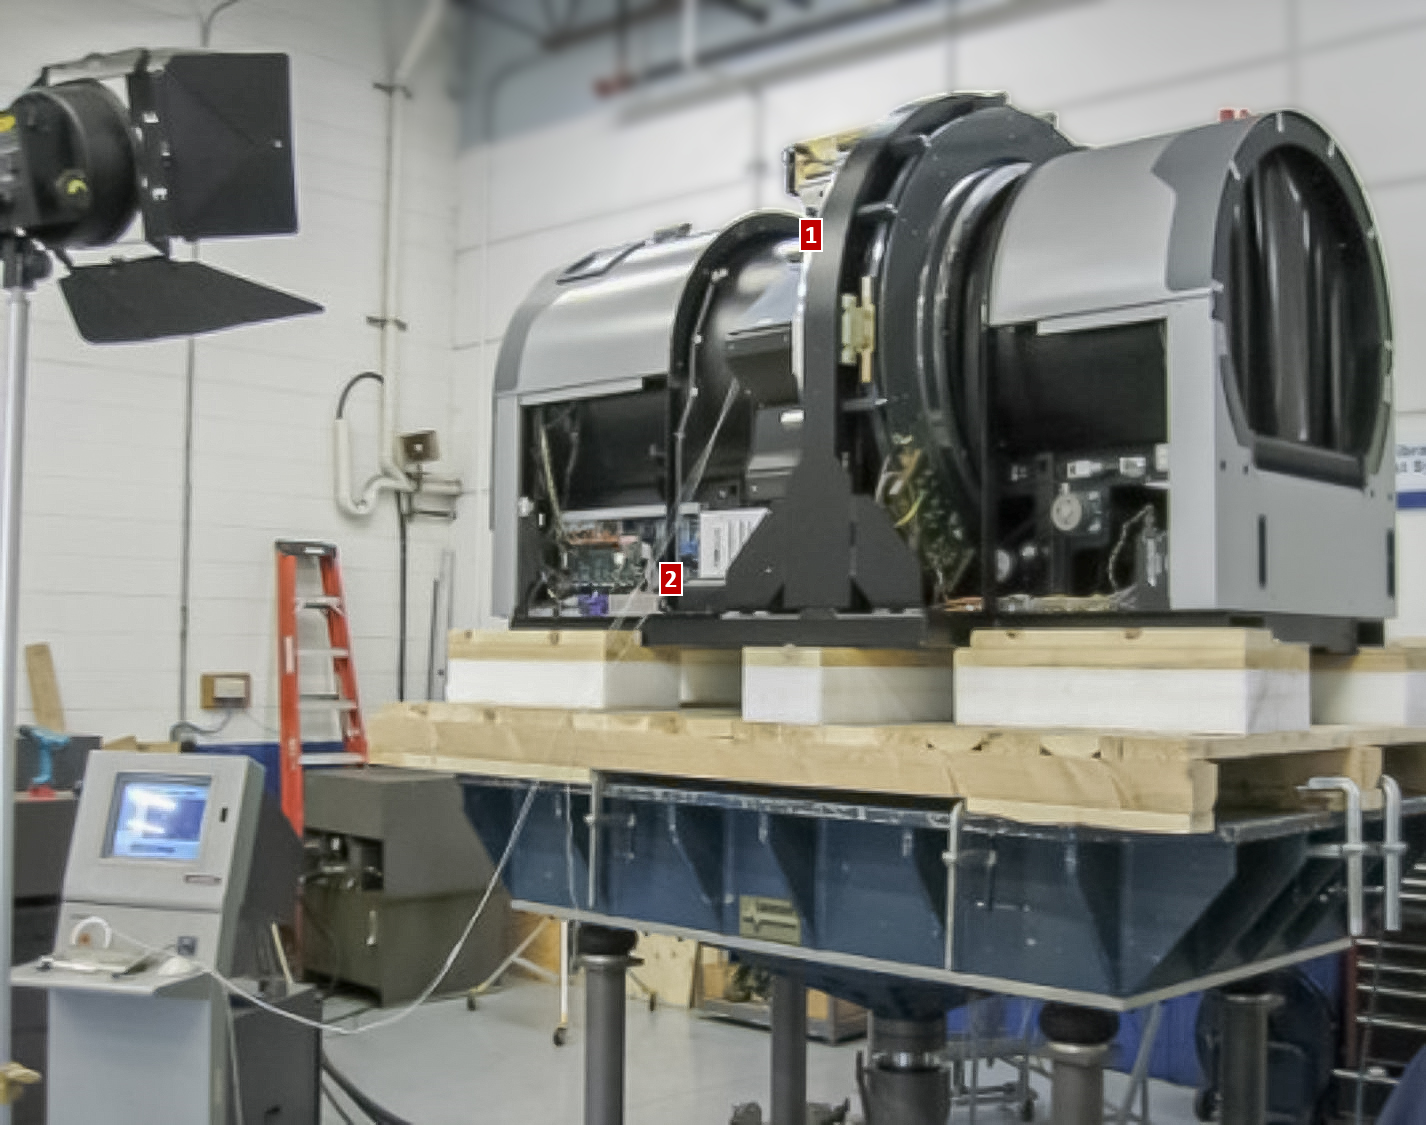
For this testing, response accelerometers were placed both on the bearing system [1], but also on the base of the product itself – just above the cushioning [2].
By measuring the response at the base of the product, they were able to determine the performance of the cushioned design itself (natural frequency and transmissibility level).
After that initial series of sweeps, it was determined that the cushioned system had a natural frequency of about 14 Hz – which was well below half the 60 Hz. critical product natural frequency (determined in the initial bare product sine sweep, and overlaid below for comparison).
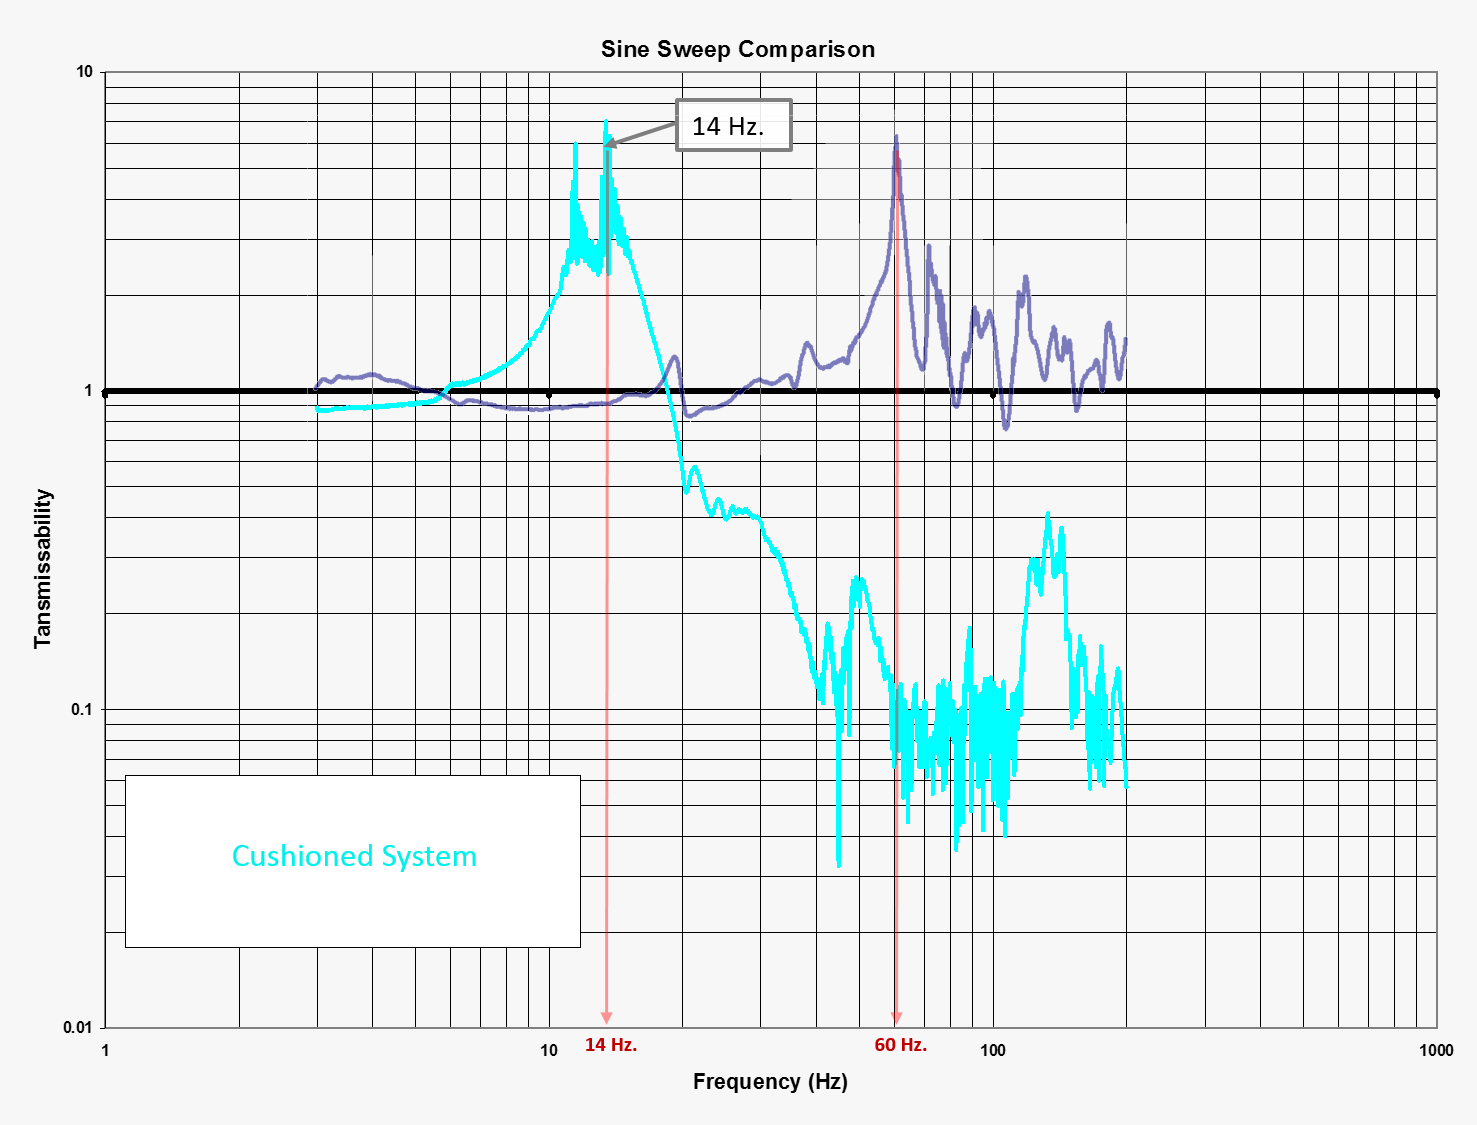
In addition, at 60 Hz, the cushioning shows that it has attenuated, or reduced the input vibration by a factor of ten (10). Those are both positive results. Now that we understand the response of the cushioned system, we can perform one final analysis to help predict how that cushioned system will respond in the anticipated transport mode(s).
Since each mode of transport possesses a unique power spectral density (PSD) shape (amplitude versus frequency), we can overlay those PSDs to see if the modes of transport will pose any additional risk to that entire cushioned system. Below are two common industry test PSDs for standard truck trailers (red: leaf-spring, green: air-ride), overlaid with the cushioned system’s natural frequency data from the sine sweep (the Y-scales are not equivalent – this overlay is for relative assessment only).
The transport PSDs possess what could be called peaks and valleys, which correspond to frequency bandwidths of comparably more/less amplitude and intensity. The first peaks are associated with the trailer suspension type (leaf-spring and air-ride).
The second peaks are typically associated with wheels and tires and the third, higher-frequency peaks are associated with the trailers’ rigid body structural members. Where there are valleys, there is comparably less intensity as compared to where there are peaks.
Considering that, you would certainly want to design a cushioning system that avoids the peak bandwidth zones if at all possible.
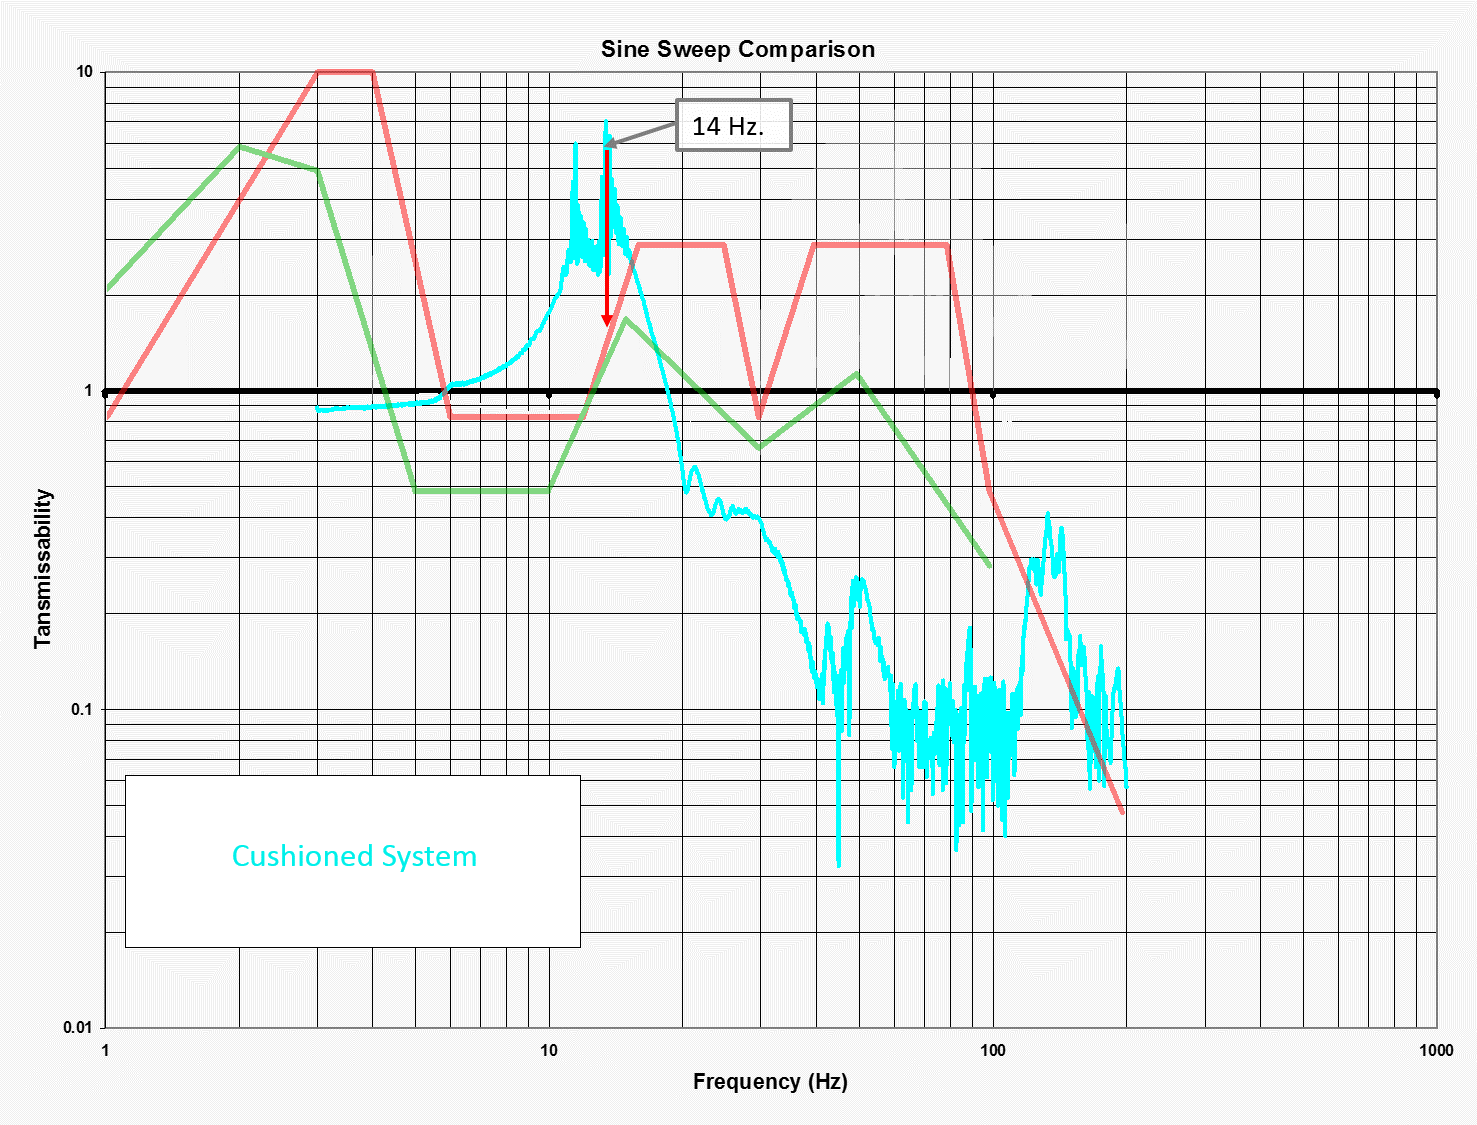
The cushioned system's 14 Hz. natural frequency does fall within that first valley of both reference PSDs, but it’s very close to rising amplitude evident in the 12-15 Hz. range.
Considering that, the product manufacturer decided to pursue a cushioning system with a softer characteristic, which would result in lowering the natural frequency of the cushioning system. Interestingly, one of the ways of creating a softer system is to actually remove, or reduce the amount cushioning material that is bearing the product weight.
After redesigning the cushioned pallet deck, the entire system was tested one last time and those comparative results are shown below (new-green, versus original-blue).
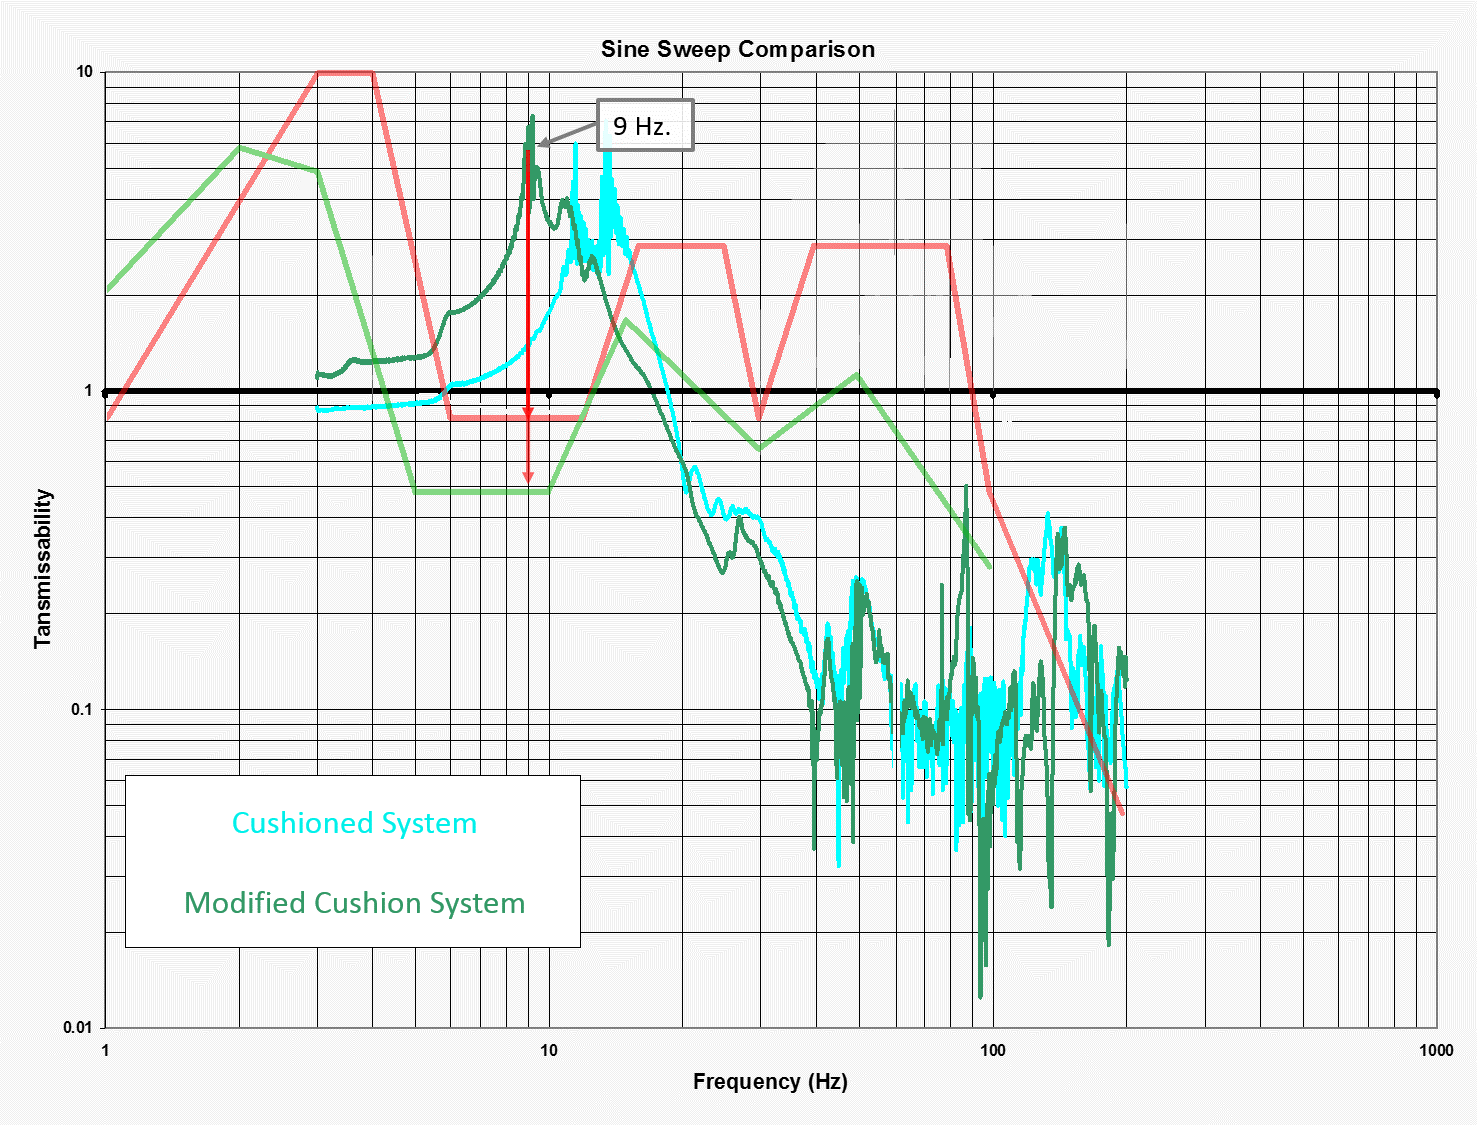
The modified cushioned deck (green trace) lowered the system natural frequency from 14 down to 9 Hz., which shifted the system's primary response more favorably into a zone of comparably lower transport input.
In the end, the product manufacturer implemented the use of this cushioned deck system and immediately recognized successful results - delivering damage-free products to their customer locations.
This is a real case study, using the original, real data, which the author helped generate in the test lab. Vibration test systems can be used for much more than simply pass-fail evaluations. In fact, vibration systems can be used to help design both more-durable products, and optimized protective packaging systems - all of which can be verified with quantitative metrics.
In Part 5 we’ll take a look at how to properly measure and characterize transport vibration - which helps to establish the design criteria for both the product and the package.