Part 1 - Before You Measure Before initiating any transport-based vibration measurements, it’s important to first establish clear expectations as to what you want to learn. Collecting “data” is easy – however collecting meaningful data that can be transformed into actionable information requires a little up-front effort. Data collected and summarized incorrectly can lead to erroneous reporting and characterizations – with real detrimental effects. Before initiating any field measurements, there are several questions you need to answer, such as:
- Why are you measuring?
- What are you hoping to learn?
- Are you planning to compare the measurement results to some previously measured data?
- Are you planning to compare the measurement results to existing test standards?
- Are you planning to use the data to create drive profiles for laboratory test equipment?
- Are you wanting to understand the input vibration (vehicle), or the response vibration (package/pallet) - or maybe the relationship of both?
- What is the planned mode, or modes of transport?
The answers to those types of questions will help prepare for the measurement activities, both in terms of the instrument hardware setup parameters, as well as the physical installation of the instruments themselves. In the next series of email communications, we’ll address some of these key Instrument Setup considerations, as well as recommended approaches as they specifically relate transport vibration measurement.
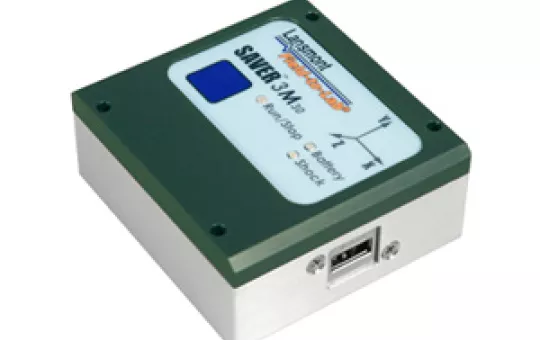
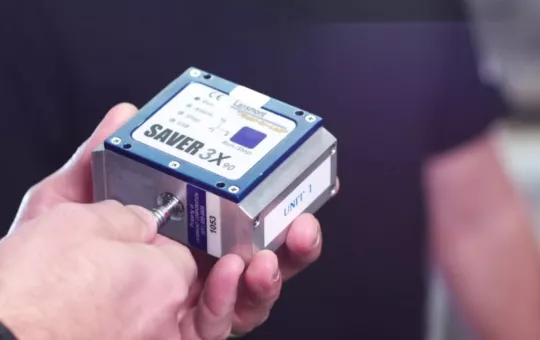
Timer vs. Signal Instrument Triggering Lansmont SAVERs capture field data as individual acceleration time-domain events and that data originates from the SAVER's internal triaxial accelerometer. When a SAVER is operating, it’s continuously sampling the environment – it never sleeps! Think of it like a camcorder that's in preview, standby mode. It's looking at everything, it's just not recording it. Because the SAVER’s memory size is fixed, you want to be sure that when you do store captured information, it will be meaningful. SAVERs only store data in its memory when a trigger condition is met (like pressing the REC button on a camcorder).
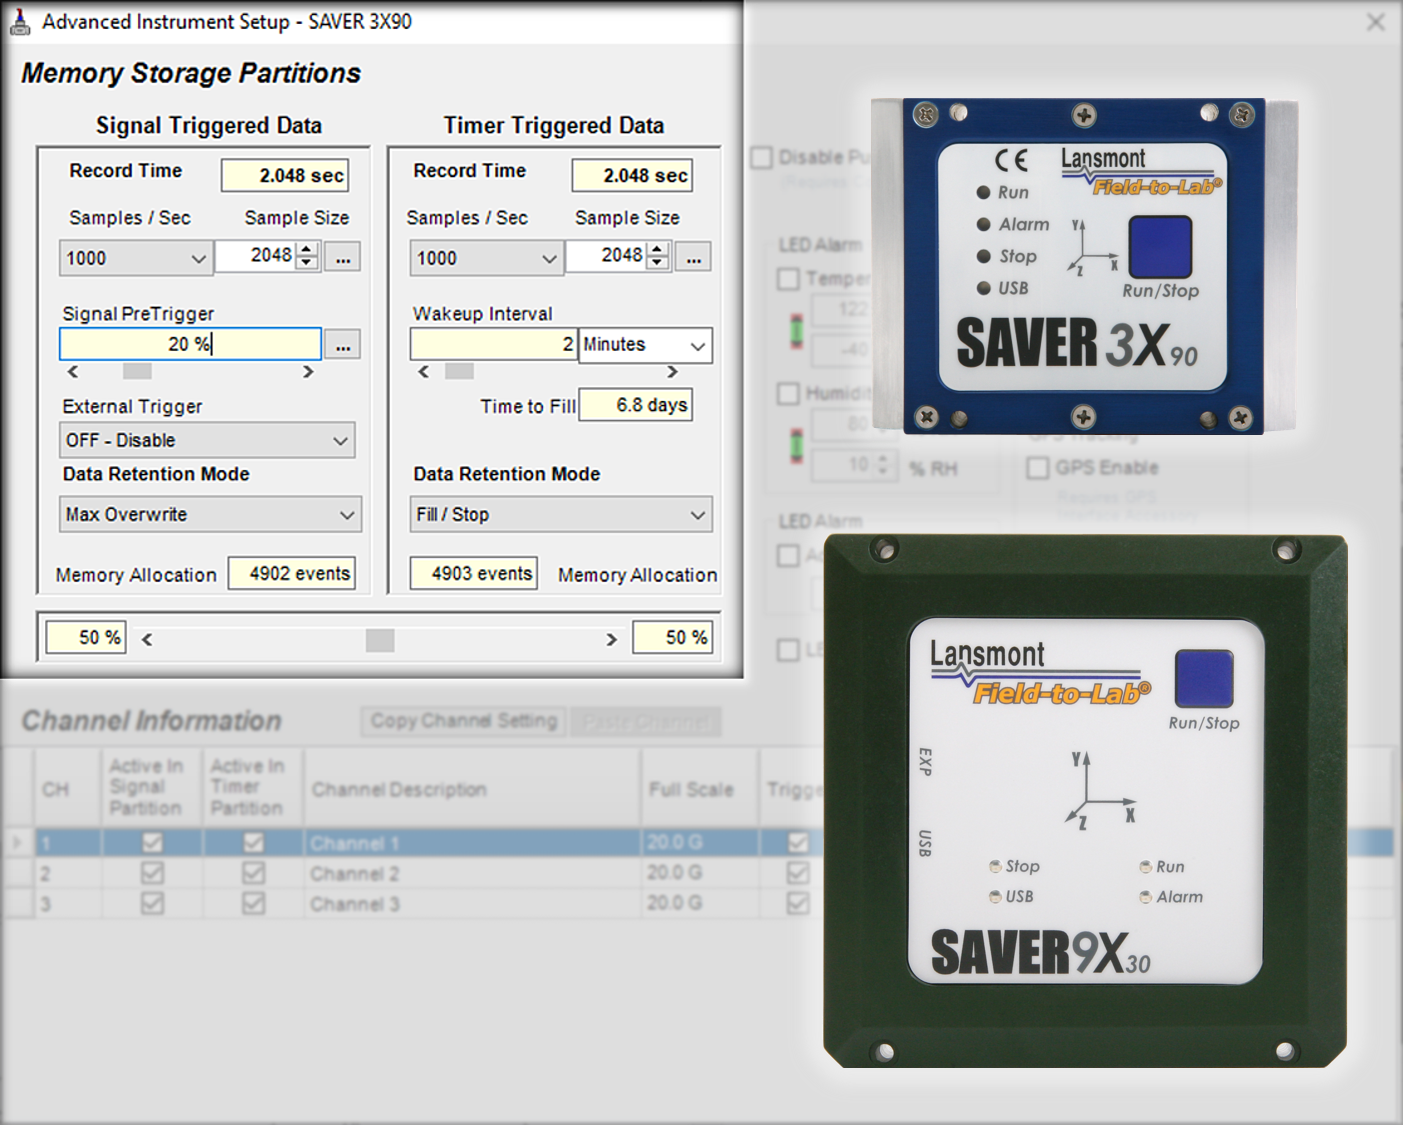
SAVERs utilize two separate user-defined triggering conditions, accessed via our SaverXware software's Advanced Instrument Setup.
Timer Triggering – recording based upon a user-defined periodic time interval, regardless of whether there is motion or not. Signal Triggering – recording when some user-defined minimum acceleration (g) level is exceeded. This can also be thought of as motion-triggering.
There are rationales for using both triggering conditions. Timer triggering is often used to capture data that provides a broad overview of a given environment. For transport vibration measurements, capturing these periodic “snapshots” of the environment can provide a representative characterization of a given environment, transport mode, etc.
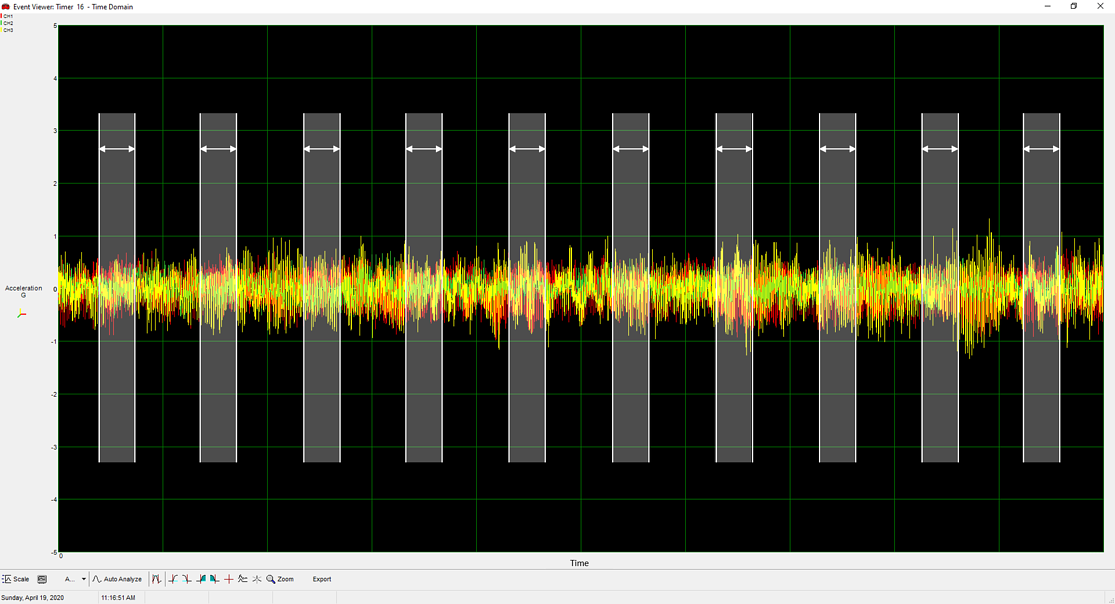
The example below shows a long duration triaxial acceleration time-history signal. If we were to capture ten shorter periodic segments of that signal in the SAVER's memory, you can see that, generally speaking, a summary of just those ten periodic snapshots would provide an accurate overall characterization of that entire time-history.
Traditionally, many of the existing industry standard random vibration transport PSD profiles (ASTM, ISO, ISTA) are based upon this type of periodic timer triggered data collection. Summary PSD profiles based upon timer-triggered data are often referred to as “uncompressed”, “unaccelerated”, “as-recorded” or “seed” data.
The summary PSD profiles that originate from the timer triggered data are typically then accelerated by increasing their intensity, which subsequently reduces the required test time to simulate a given transport route. There are different approaches used to achieve accelerated test plans, and caution must be given to not over-accelerate the test levels to unrealistic intensities. When using timer triggered data collection, it’s inevitable that you will record data where the transport vehicle was not moving.
Of course, you wouldn’t want to include that kind of “no motion” data in any summary analysis as it would artificially pull down the overall intensity of the summary PSD profile. It’s relatively simple to remove those events from the summary during the data analysis phase, however those events do use part of the finite instrument memory. With that in mind, it's important to note that you're normally more focused on dynamic vibration data of some significance - or that data that poses potential risk. Additionally, if you use only timer triggering for your data collection, you run the risk of not capturing some of the larger dynamics that occur outside, or in between those triggering intervals.
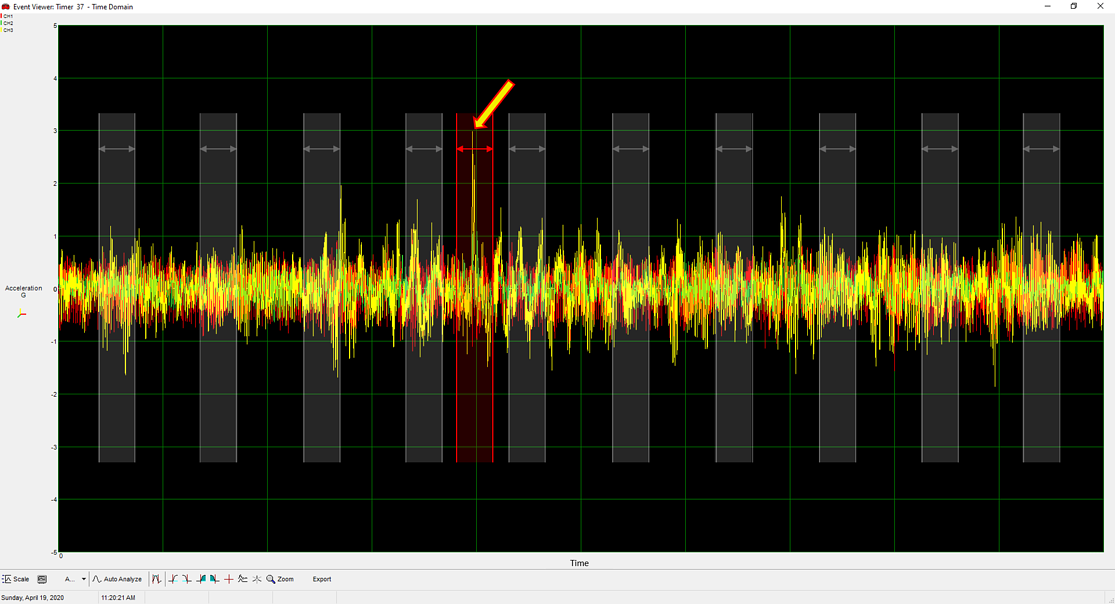
In the example below, you’ll notice that in between the 4th and 5th timer interval, there was a large dynamic input that occurred – peaking at nearly twice the running average. That large dynamic input may possess damage potential to your product and protective packaging. If you were to only capture those ten periodic samples, you would never know that large input had occurred. To assure we capture those large dynamics, we use what is called Signal Triggering.
Signal Triggering works by storing data only when a user-defined acceleration threshold is exceeded. Often signal triggering is used on SAVERs to record shock events, which is certainly valid. However, for transport vibration measurements, signal triggering can also be used to capture data only when the transport vehicle is in motion. This is done by setting the triggering threshold relatively low – so the instrument is sensitive to motion. In that scenario, only data of predefined significance is captured. It’s important to understand that the threshold trigger setting can bias the intensity of the resulting PSD summary. For instance, if you use two instruments to record a truck journey -one with a 0.25g trigger, and one with a 1.0g trigger, their corresponding vibration summary analyses will be different.
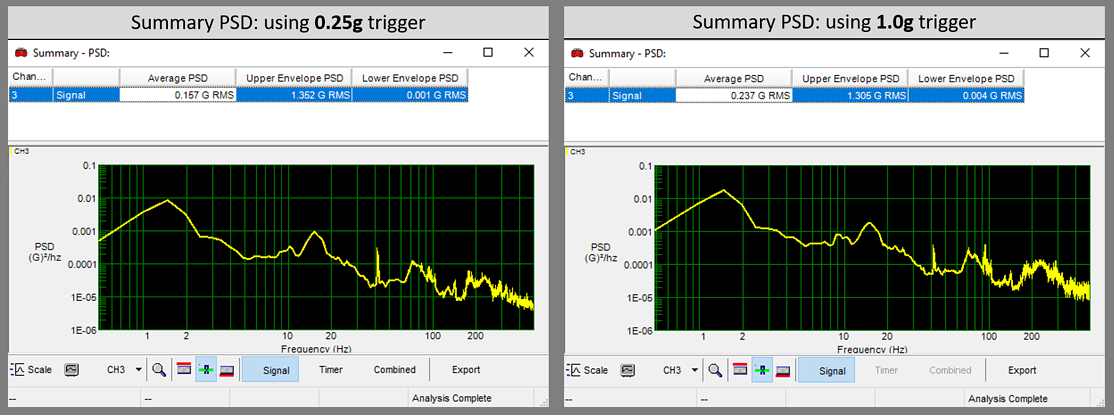
The 1.0g triggered data will result in a PSD with a much higher overall amplitude as compared to the 0.25g triggered data. There may be justifiable reasons for using either trigger, but it’s important to understand the implications. Below is an example of summarized PSD data from an air-ride truck trailer, using both a 0.25g and 1.0g trigger. The shape of the two profiles matches very well, however the PSD from the 1.0g triggered data has a summary Grms level 51% greater than the 0.25g triggered data.
SAVERs allow for simultaneous timer and signal triggering during any recording session. Those triggering conditions operate independently, and the corresponding data is stored in separate memory locations. Additionally, the amount of memory allocated to each type of data is user definable. For optimized transport measurement setups, it's possible to record tens of thousands of individual acceleration time-histories in just one recording session.
In Part 2, we'll address key considerations when setting both the instrument sampling rate and sample size.
Part 1 - Before You Measure
Before initiating any transport-based vibration measurements, it’s important to first establish clear expectations as to what you want to learn.
Collecting “data” is easy – however collecting meaningful data that can be transformed into actionable information requires a little up-front effort.
Data collected and summarized incorrectly can lead to erroneous reporting and characterizations – with real detrimental effects. Before initiating any field measurements, there are several questions you need to answer, such as:
- Why are you measuring?
- What are you hoping to learn?
- Are you planning to compare the measurement results to some previously measured data?
- Are you planning to compare the measurement results to existing test standards?
- Are you planning to use the data to create drive profiles for laboratory test equipment?
- Are you wanting to understand the input vibration (vehicle), or the response vibration (package/pallet) - or maybe the relationship of both?
- What is the planned mode, or modes of transport?
The answers to those types of questions will help prepare for the measurement activities, both in terms of the instrument hardware setup parameters, as well as the physical installation of the instruments themselves. In the next series of email communications, we’ll address some of these key Instrument Setup considerations, as well as recommended approaches as they specifically relate transport vibration measurement.
Timer vs. Signal Instrument Triggering
Lansmont SAVERs capture field data as individual acceleration time-domain events and that data originates from the SAVER's internal triaxial accelerometer.
When a SAVER is operating, it’s continuously sampling the environment – it never sleeps! Think of it like a camcorder that's in preview, standby mode. It's looking at everything, it's just not recording it. Because the SAVER’s memory size is fixed, you want to be sure that when you do store captured information, it will be meaningful.
SAVERs only store data in its memory when a trigger condition is met (like pressing the REC button on a camcorder). SAVERs utilize two separate user-defined triggering conditions, accessed via our SaverXware software's Advanced Instrument Setup.
Timer Triggering – recording based upon a user-defined periodic time interval, regardless of whether there is motion or not.
Signal Triggering – recording when some user-defined minimum acceleration (g) level is exceeded. This can also be thought of as motion-triggering.
There are rationales for using both triggering conditions.
Timer triggering is often used to capture data that provides a broad overview of a given environment. For transport vibration measurements, capturing these periodic “snapshots” of the environment can provide a representative characterization of a given environment, transport mode, etc.
The example below shows a long duration triaxial acceleration time-history signal. If we were to capture ten shorter periodic segments of that signal in the SAVER's memory, you can see that, generally speaking, a summary of just those ten periodic snapshots would provide an accurate overall characterization of that entire time-history.
Traditionally, many of the existing industry standard random vibration transport PSD profiles (ASTM, ISO, ISTA) are based upon this type of periodic timer triggered data collection.
Summary PSD profiles based upon timer-triggered data are often referred to as “uncompressed”, “unaccelerated”, “as-recorded” or “seed” data. The summary PSD profiles that originate from the timer triggered data are typically then accelerated by increasing their intensity, which subsequently reduces the required test time to simulate a given transport route. There are different approaches used to achieve accelerated test plans, and caution must be given to not over-accelerate the test levels to unrealistic intensities.
When using timer triggered data collection, it’s inevitable that you will record data where the transport vehicle was not moving. Of course, you wouldn’t want to include that kind of “no motion” data in any summary analysis as it would artificially pull down the overall intensity of the summary PSD profile. It’s relatively simple to remove those events from the summary during the data analysis phase, however, those events do use part of the finite instrument memory. With that in mind, it's important to note that you're normally more focused on dynamic vibration data of some significance - or that data that poses a potential risk.
Additionally, if you use only timer triggering for your data collection, you run the risk of not capturing some of the larger dynamics that occur outside, or in between those triggering intervals. In the example below, you’ll notice that in between the 4th and 5th timer interval, there was a large dynamic input that occurred – peaking at nearly twice the running average.
That large dynamic input may possess damage potential to your product and protective packaging. If you were to only capture those ten periodic samples, you would never know that large input had occurred. To assure we capture those large dynamics, we use what is called Signal Triggering.
Signal Triggering works by storing data only when a user-defined acceleration threshold is exceeded. Often signal triggering is used on SAVERs to record shock events, which is certainly valid.
However, for transport vibration measurements, signal triggering can also be used to capture data only when the transport vehicle is in motion. This is done by setting the triggering threshold relatively low – so the instrument is sensitive to motion.
In that scenario, only data of predefined significance is captured. It’s important to understand that the threshold trigger setting can bias the intensity of the resulting PSD summary. For instance, if you use two instruments to record a truck journey -one with a 0.25g trigger, and one with a 1.0g trigger, their corresponding vibration summary analyses will be different.
The 1.0g triggered data will result in a PSD with a much higher overall amplitude as compared to the 0.25g triggered data. There may be justifiable reasons for using either trigger, but it’s important to understand the implications.
Below is an example of summarized PSD data from an air-ride truck trailer, using both a 0.25g and 1.0g trigger. The shape of the two profiles matches very well, however, the PSD from the 1.0g triggered data has a summary Grms level 51% greater than the 0.25g triggered data.
SAVERs allow for simultaneous timer and signal triggering during any recording session.
Those triggering conditions operate independently, and the corresponding data is stored in separate memory locations. Additionally, the amount of memory allocated to each type of data is user definable.
For optimized transport measurement setups, it's possible to record tens of thousands of individual acceleration time-histories in just one recording session.
In Part 2, we'll address key considerations when setting both the instrument sampling rate and sample size.