When shipping products from one location to another, you want high confidence that upon arrival, the product has maintained its original integrity without experiencing any damage along the way.
Lansmont SAVER™ products, sometimes referred to as shock loggers, data loggers or data recorders, can be used to accompany a product during its journey to document when large dynamic events occur. The specific information recorded during those events determines the true ability to both properly interpret the data, and subsequently act upon the data with confidence.
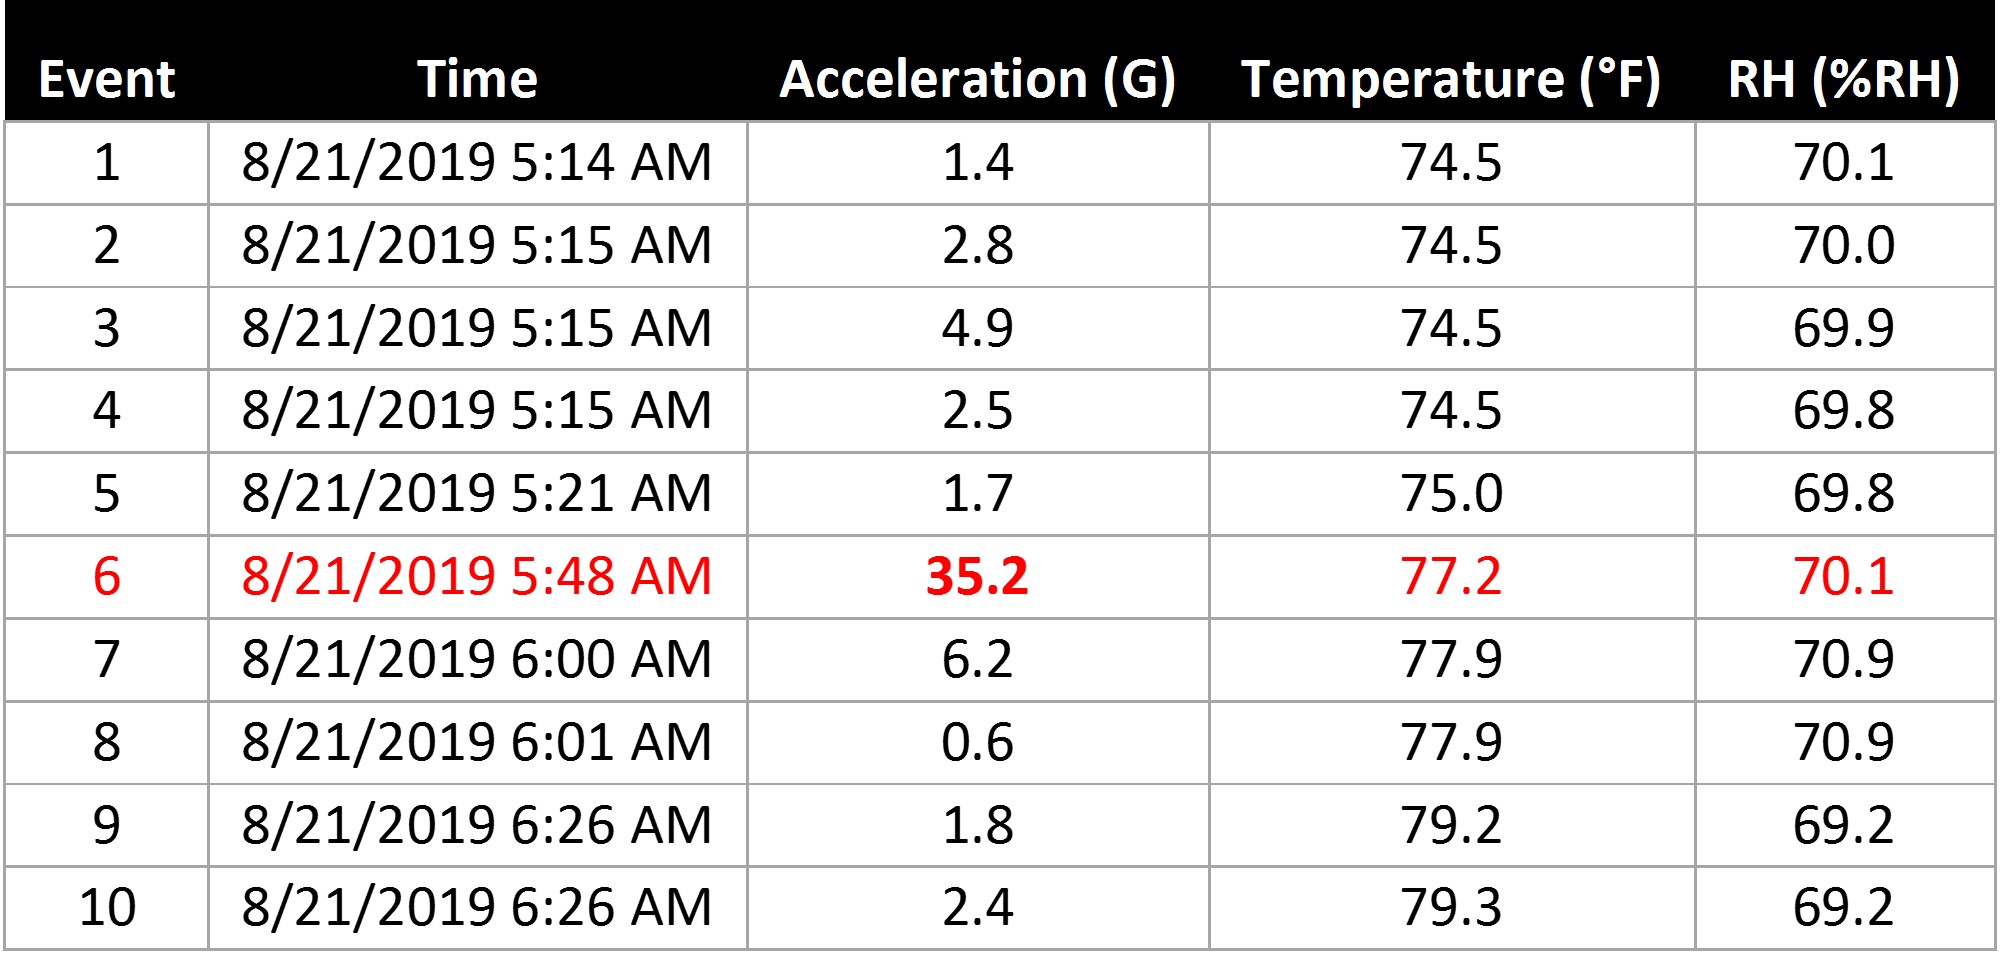
Impact data is captured by accelerometers embedded in the data loggers. Accelerometers measure change in acceleration, described in terms of Gs. Transport data is often logged and presented in tabular form.
Acceleration events are described not only by their G level (amplitude), but also by their time duration (seconds), and their velocity change (in/sec, m/s, etc.). Thus, to fully define any event, we need the full time-history acceleration waveform.
Capturing full acceleration waveforms provides the ability to visualize the entire event and determine not only the acceleration amplitude, but also the event duration and velocity change. It’s critical to have all that information to properly assess the severity of any recorded event.
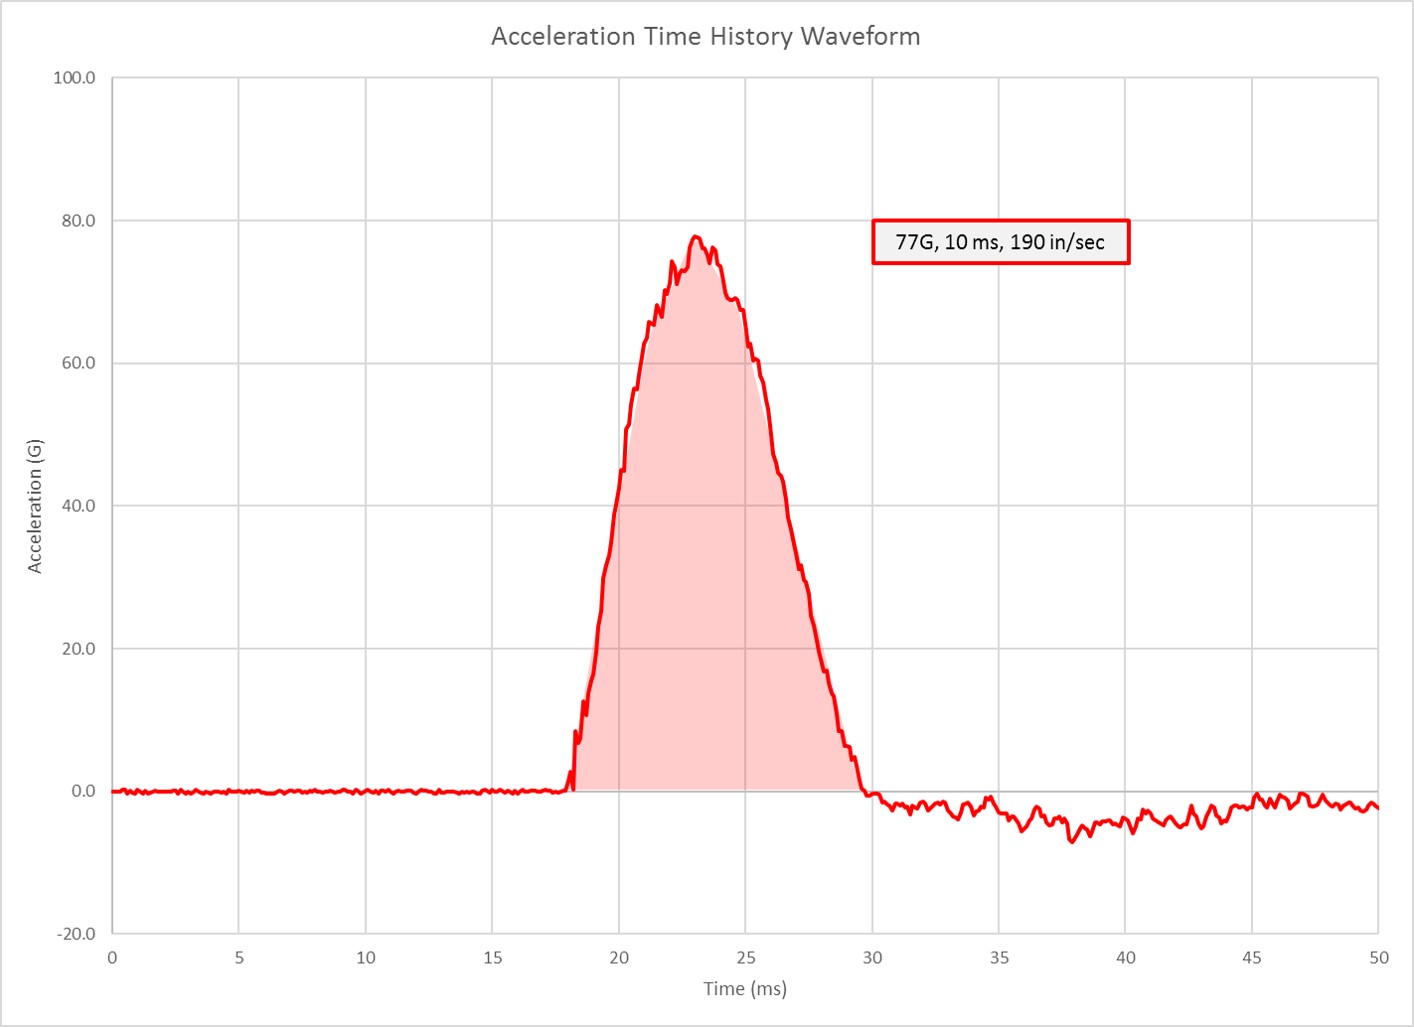
Below is a 77G acceleration time-history waveform. That waveform has an overall time duration of 10 milliseconds (ms). If we integrate that waveform, we calculate its velocity change, which is represented by the area underneath the waveform (shaded red). For this event, the velocity change is 190 in/sec.
Below we’ve added another 77G acceleration waveform to the plot. However, this new event occurred over a shorter time duration (1.5 ms), which produces a velocity change of 28 in/sec (shaded green).
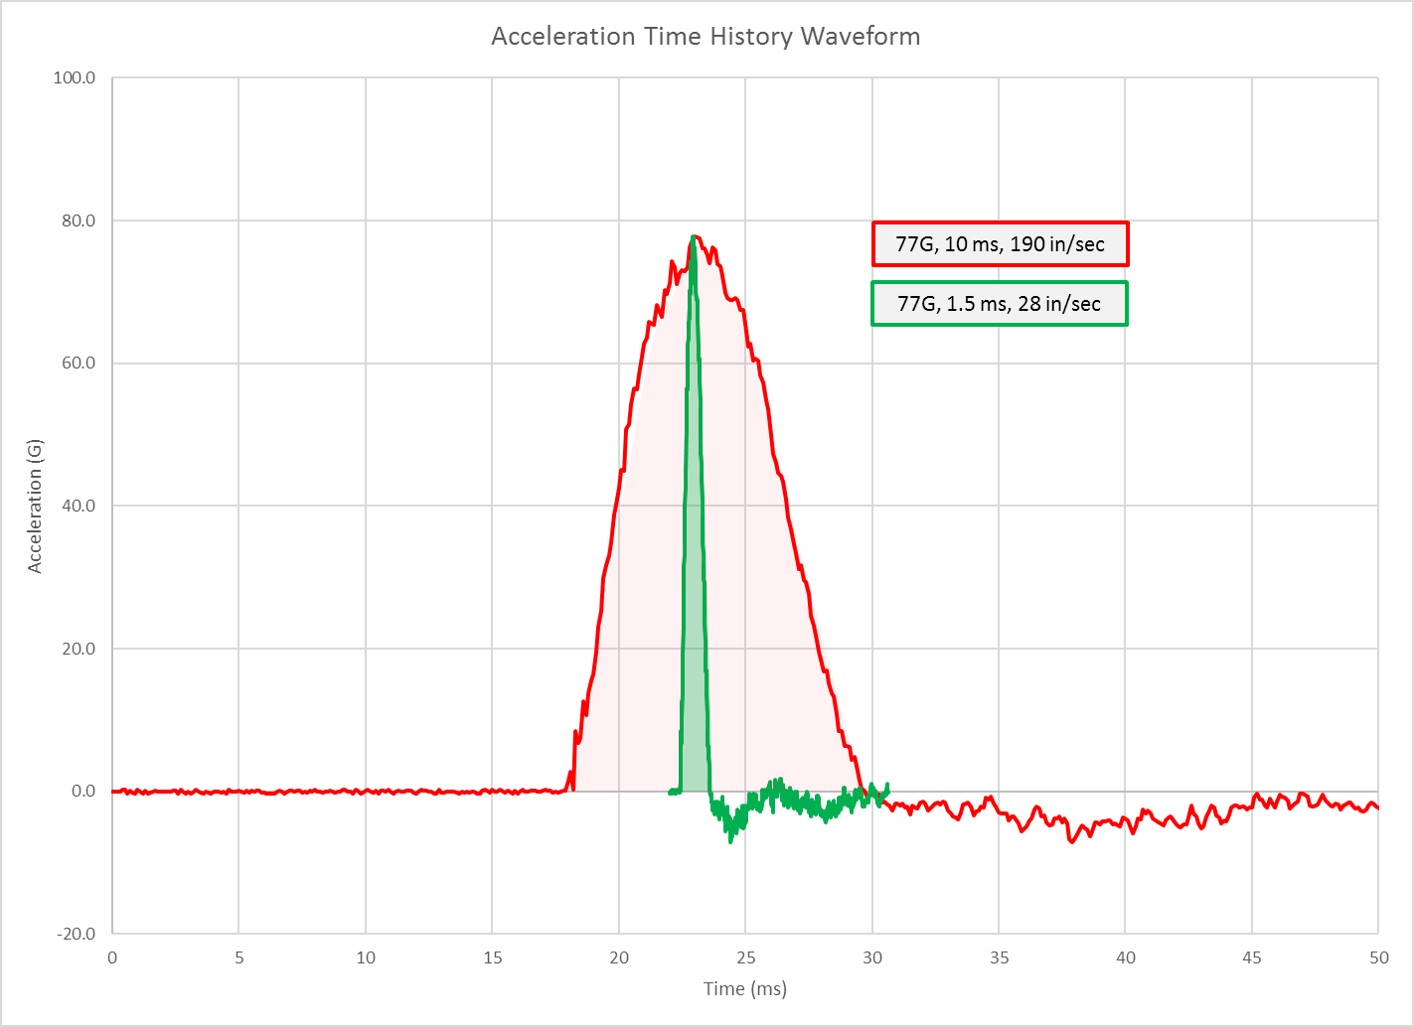
Are these two events equally severe? Absolutely not! The first event possesses nearly seven times the velocity change as compared to the second event. Though velocity change is not a measure of energy, it is directly proportional to energy, so it’s an additional attribute that helps truly describe and define the overall severity of a shock, or impact event.
We wouldn’t have been able to make the determination without having the entire acceleration time-history waveform to review and assess.
All Lansmont SAVER™ products capture high-fidelity, full triaxial acceleration waveforms. Click on the image below to download our SAVER Product Matrix.
In the example above, someone might look at Event #6 and see 35Gs and become concerned that something bad may have occurred during the journey. The concern would likely be valid, but it’s challenging to make any determination on that reported acceleration value without context.
To achieve the highest level of confidence, it’s important to understand more about the specific event - we do that by evaluating the event waveforms.

Contact Us for More Information
Next Week - Part 2 - Shock pulse frequency content and its damage potential