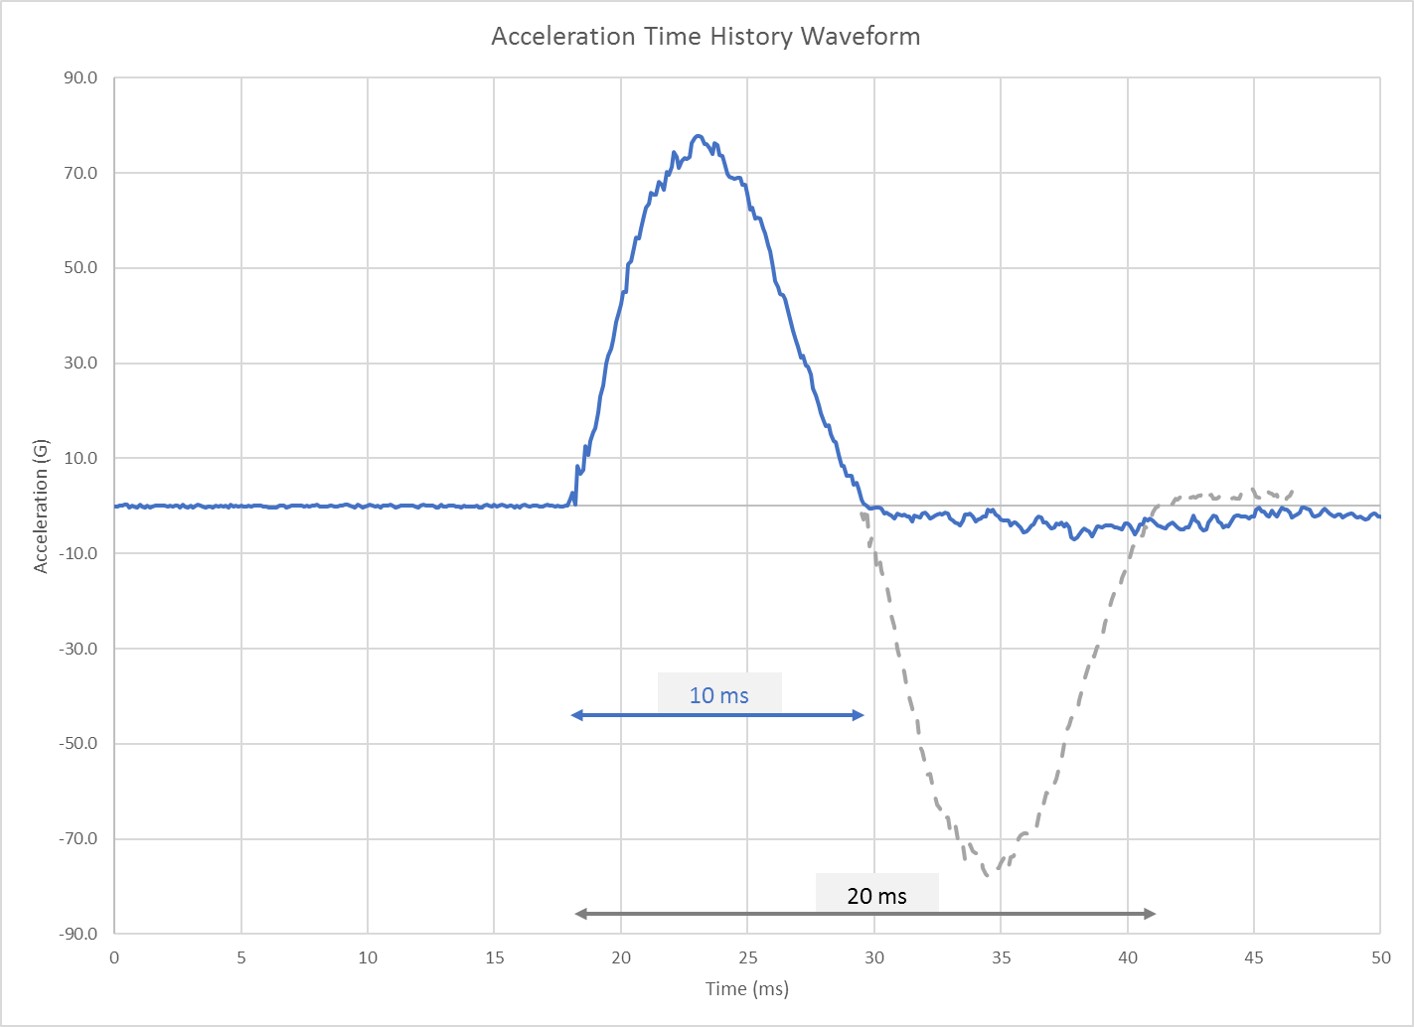
Environmental shocks typically possess a half-sine characteristic. If we project that half-sine characteristic into a theoretical full period sine wave, we’re able to determine the relative frequency content associated with a shock pulse.
In the example below, the blue recorded event has a time duration of 10 ms. If we project that half sine wave characteristic out over time, we can see that the full period of that theoretical sine wave would be 20 ms. From that, we can determine the frequency of the shock event which is equal to the inverse of the period (1 divided by the period), or 50 Hz.
That’s additional, helpful information embedded within the shock waveform that can be used to assess its overall severity. If you know your packaged product has a resonant characteristic at or near that 50 Hz, you could expect that the 10 ms shock event below would possess comparably more damage potentialthan say a 20 or 30 ms impact.
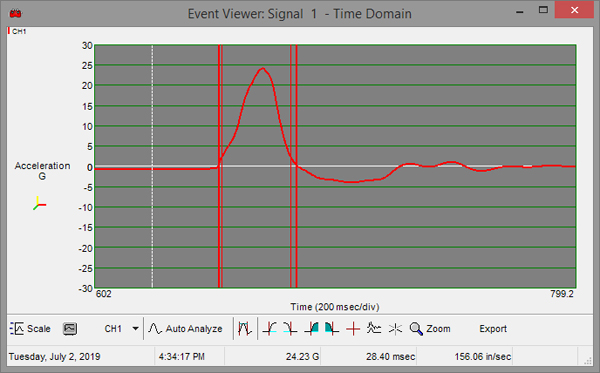
The SaverXware software provides an event analysis called SRS, or Shock Response Spectrum. In simple terms, that SRS analysis provides a theoretical range of responses to a measured time-domain shock pulse. For instance, the SAVER shock event below can be described as a 24G, 28 ms event.
SRS plots display a number of theoretical responses of tuned spring/mass systems to the reference shock pulse. This can be useful if you know resonant characteristics about your product and/or package.
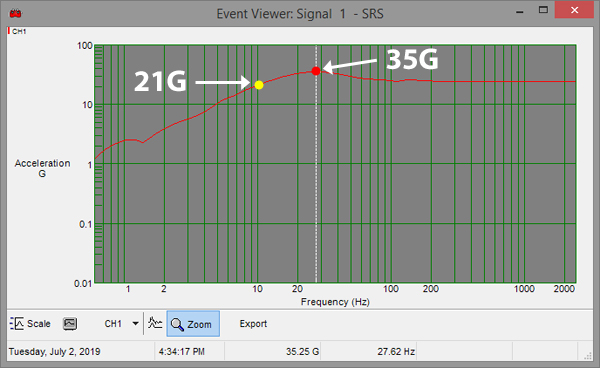
The SRS plot below is described by Acceleration (G) on the Y-axis and Frequency (Hz) on the X-axis. Generating an SRS of that SAVER event allows us to predict how a product/widget with any number of resonant frequency characteristics would subsequently respond.
For instance, if we placed an accelerometer on an item with a 10 Hz resonant frequency, and then input that 24G shock pulse, we would expect to measure a peak acceleration response of only 21G - which is less than the input. For an item with a 27 Hz characteristic, we would expect the peak response to that same input to be just over 35G - which is eleven Gs greater than the input. SRS analyses can be used to predict the true response of any measured environmental shock event. The more you know about your product and package frequency response characteristics, the better you'll be able to predict their relative performance in the real world.
Contact Us for More Information
Next Week - Part 3 - Triaxial resultant interpretation and directional impacts