Pre-Trigger Free-Fall Analysis
When SAVER shock and vibration data recorders are “on” and operational, they are continuously sampling the environment – never sleeping, never in a low-power mode. They use a memory buffer which allows them to capture and record what is called Pre-Trigger data.
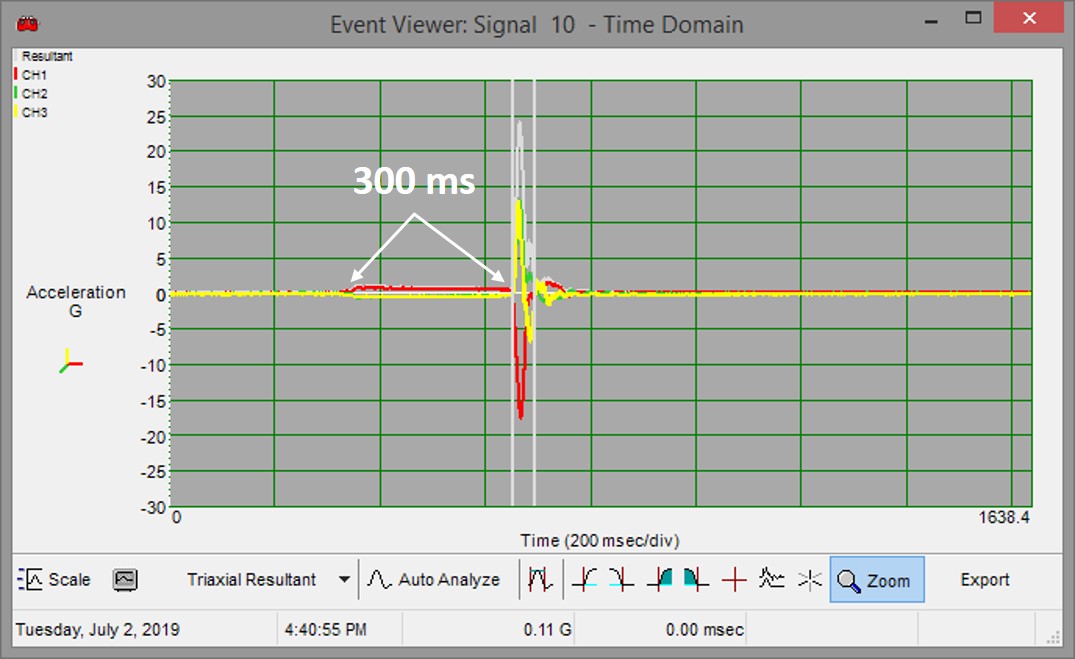
The instrument trigger threshold (user-defined G level) and the amount of pre-trigger data are selectable properties. By capturing pre-trigger data, we’re able to visualize and determine what happened just before the event trigger (impact) happened. In the example below, we can zoom out and see that approximately 300 ms before the primary impact, there was a slight change in acceleration detected, which lasted right up until the primary impact.
That specific change in acceleration was approximately 1G, which is an indication that the SAVER was experiencing free-fall just before the large impact. Since we know the amount of time the SAVER was experiencing that free-fall, we can accurately calculate the height from which it was dropped. Without the full acceleration waveform, and pre-trigger capability, this analysis would not be possible.
Video Example/Demonstration of Instrument Pre-Trigger Data in Time-Domain
Pre-Trigger - Stationary or Moving Before Trigger?
If that pre-trigger data shows a perfectly flat line ahead of the primary impact, it’s an indication the SAVER was stationary (not moving) just before impact. That flat pre-trigger characteristic would indicate that something else was moving and bumped into the SAVER. Conversely, if the pre-trigger data shows some amount of activity before the impact, it’s a good indication that the SAVER was in motion – either being transported, carried, or maybe even moving down a conveyor.
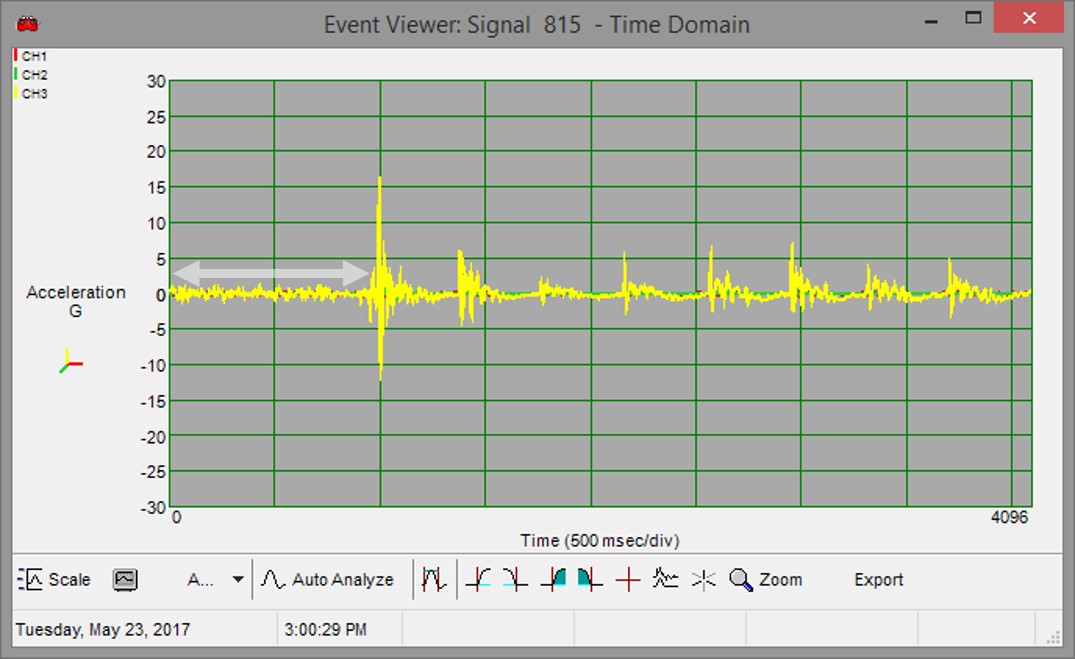
In the example below, the data was captured with a 20% pre-trigger setting, which means the primary impact begins two divisions in on the X-axis in the recording window. If you look at the first two x-axis time divisions of the window, it’s evident that there is a dynamic data being measured within that period, which is indicative of movement.
After the primary large input, there is a repetitive beat pattern, which has a signature of something like concrete roadway section transitions. So yes, there is a large vertical input of more than 15G in the data - but that wasn't the result of a drop, or something hitting the item. Instead, the input was due to a change in roadway surface, which was transmitted through the vehicle body and suspension, causing the item to jump in the back of the vehicle - in this case, continuously during that time segment. That pre-trigger data helps provide insight as to what was happening just before the large input.
That information can be used to quickly determine if an input was due to handling, or the result of general transport/vehicle input.
Measured Roadway Beat Pattern and Bike Rack Response
Seeing is believing. By having the full acceleration time-history waveform captured and available for analysis, we’re able to determine key, informative characteristics of each recorded event.
- Amplitude
- Duration
- Velocity Change
- Frequency Content
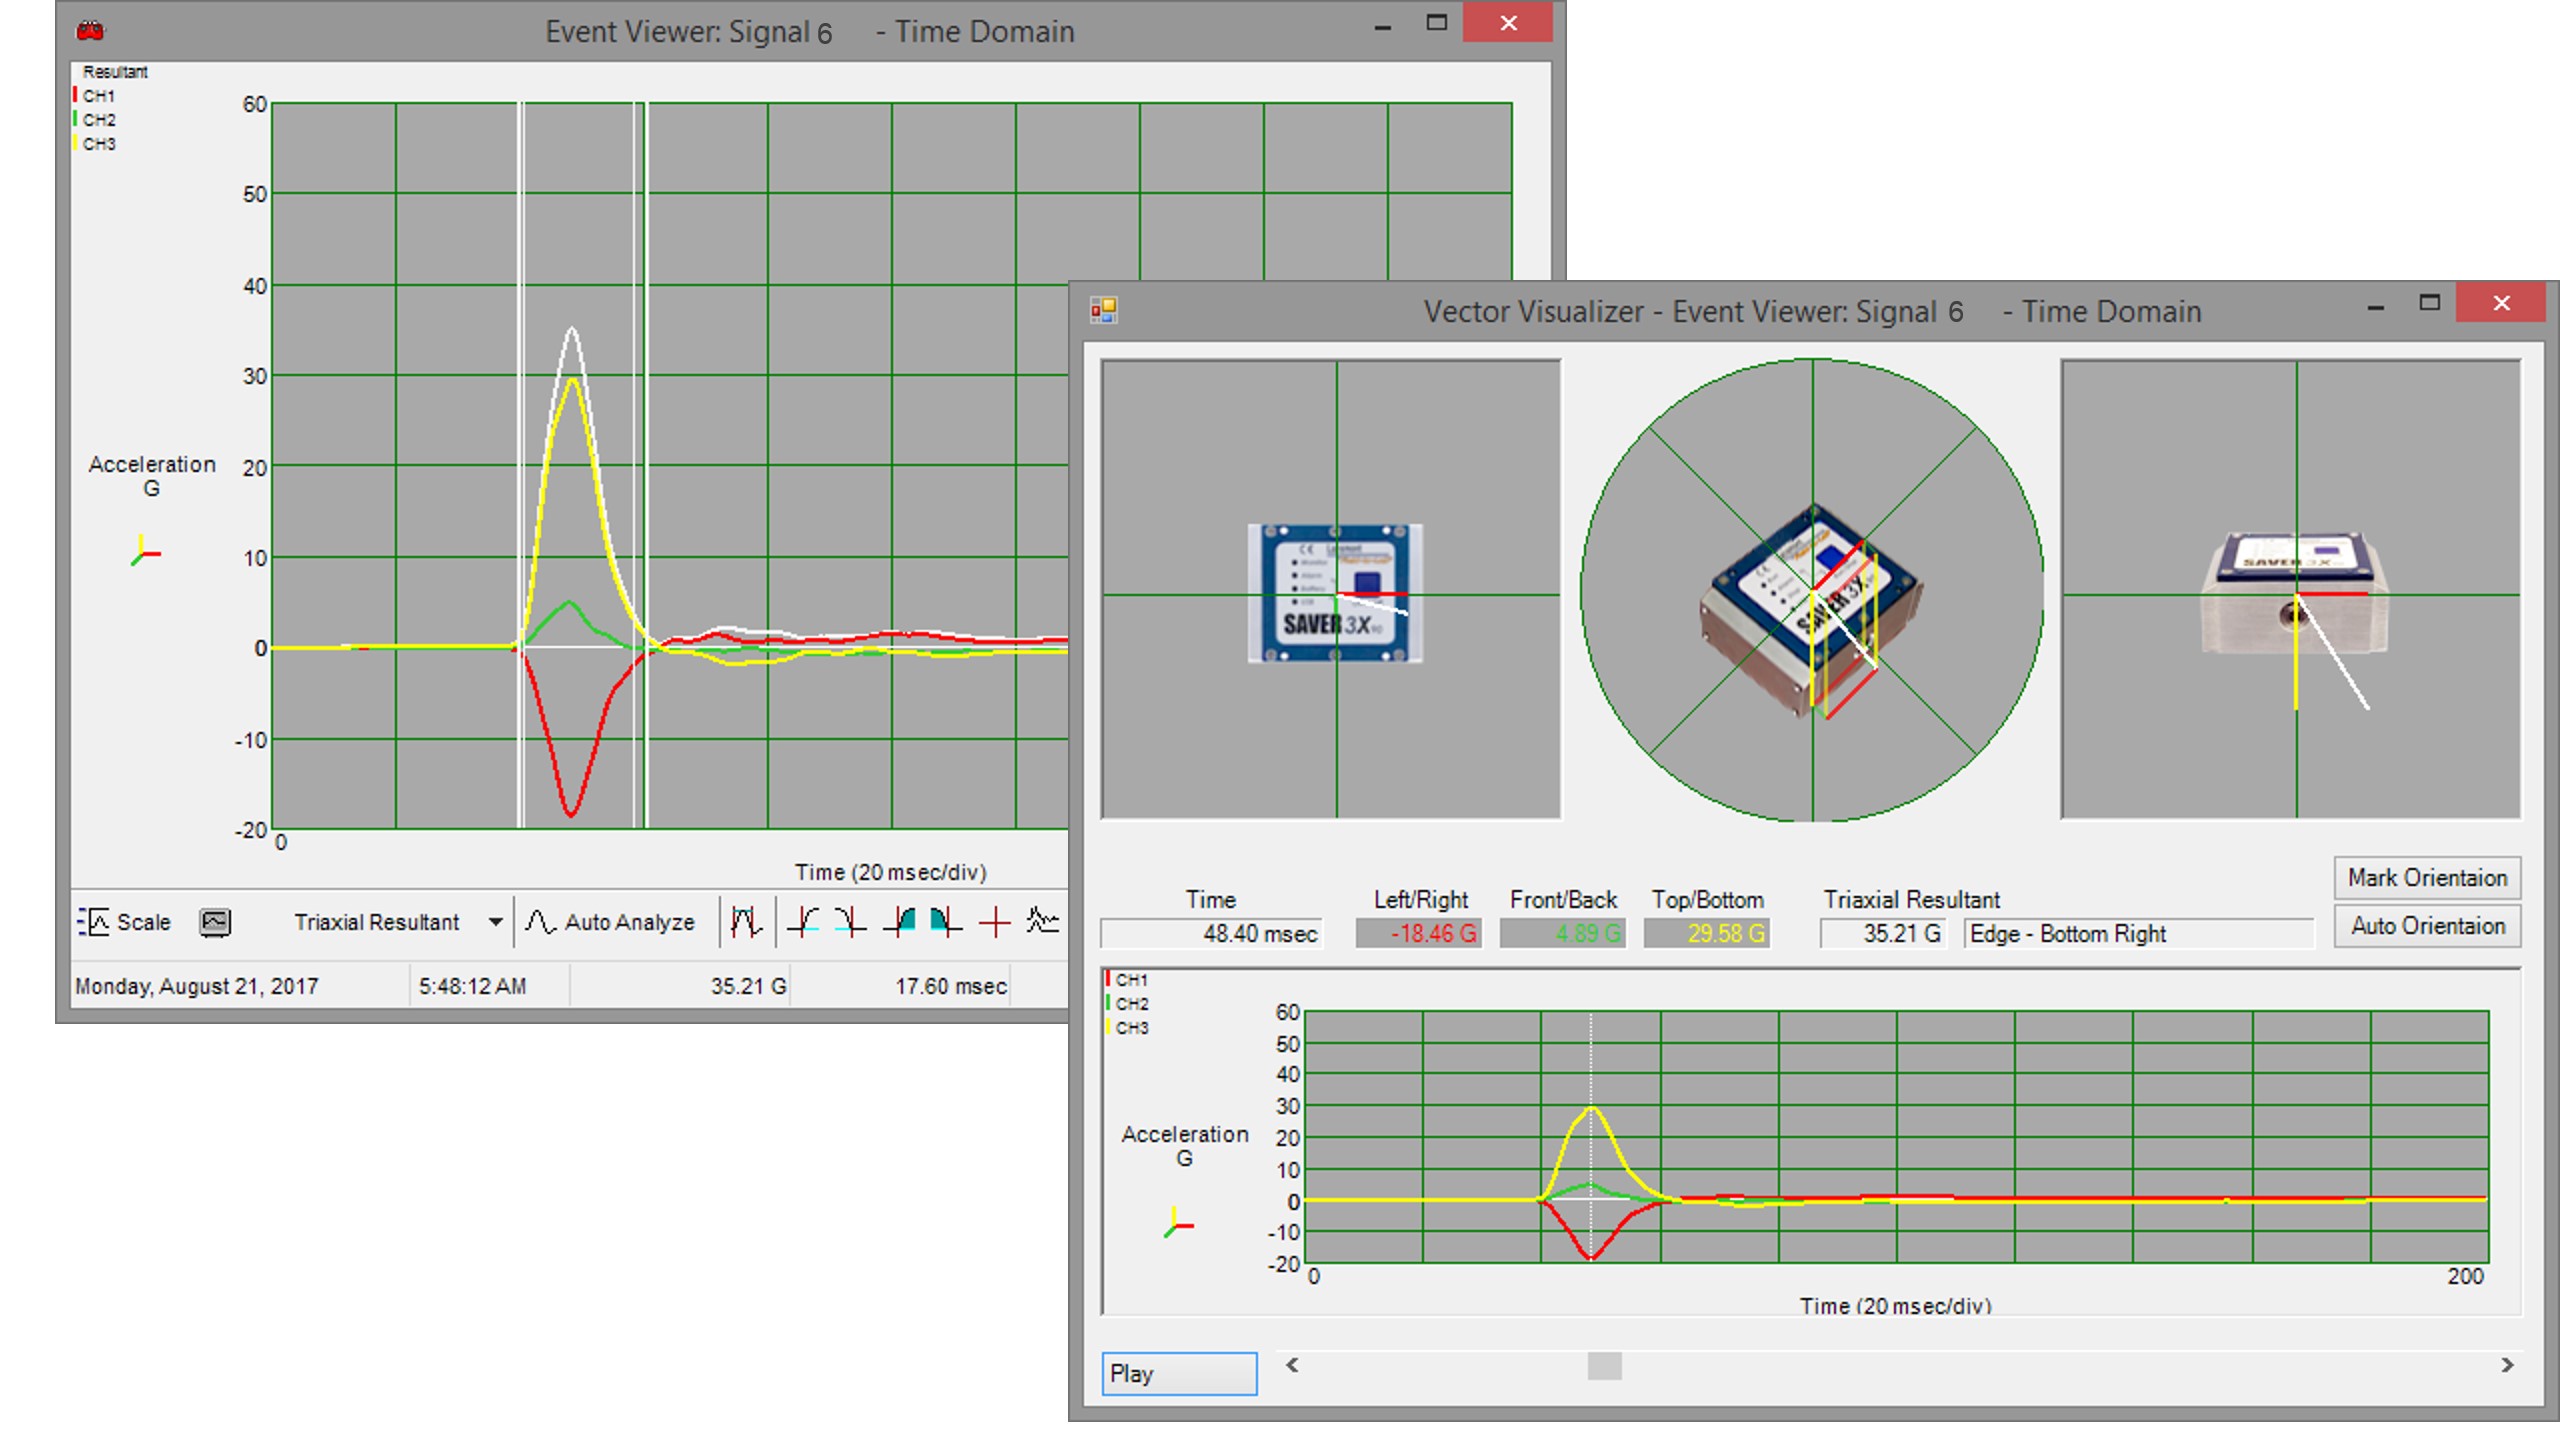
- True Direction of Impact
- Pre-Trigger Data
All that information can then be used to accurately and confidently describe the severity of each recorded event. So back to Part 1 of this series where we asked – Is 35G bad? The right answer is – Use a Lansmont SAVER and determine the answer with confidence for yourself!