When analyzing field data in SaverXware, it’s not uncommon to spot a trend from one of the QuickHistory views that makes you want to focus-in further to investigate the characteristics of that trend. Many times, field measurements are made over periods of days, if not weeks.
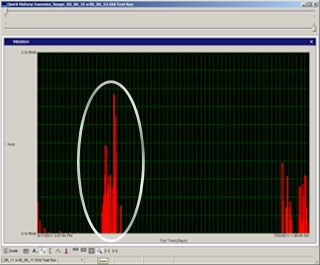
For international shipments, cargo might utilize multiple modes of transport while traveling from the point of origin to the final destination. The example to the right shows a SaverXware QuickHistory chart, detailing a vibration measurement that took place over a nearly 66-day period, displayed across a horizontal timeline.
From that chart, attention might be drawn to a grouping of comparably higher amplitude events, which appear about ¼ of the way in from the beginning of the measurement. So how can we focus in to that data of interest? SaverXware provides users with different utilities they can apply to filter the data to measured events of key interest. One of those utilities allows users to select summary events directly from within the QuickHistory window itself.
When viewing the QuickHistory, users have access to the Zoom utility, which allows for adjusting the viewable timeline, such that they can “zoom” in to data of interest.
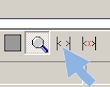
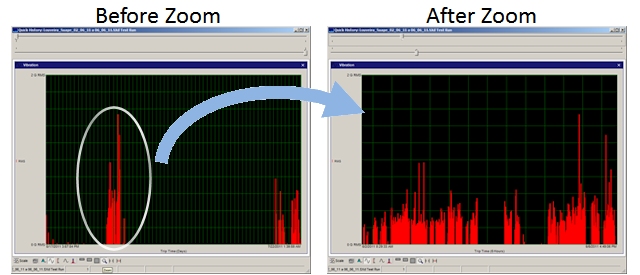
By clicking on the Zoom magnifying glass just below the QuickHistory timeline, two slider bars appear directly above the QuickHistory graph, allowing users to adjust the graph’s beginning and end times. Below, the “Before Zoom” graph on the left shows all the data recorded during the 66-day measurement (7,334 events). After using the sliders to zoom into the data of interest, the "After Zoom" graph on the right displays a horizontal timeline of approximately 4 days.
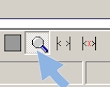
At this point, we only changed the view of the data, but we haven't yet changed the total event population of Summary-classified events. To change our Summary selection to only those 4 days’ worth of events, we can simply click on the Select Range for Summary icon, which is just to the right of the Zoom magnifying glass.
By clicking this selection, SaverXware selects only the events from that zoom range for summary, which in this example is about 720 events, simultaneously de-selecting the other 6,615 events that are no longer of interest. As a result of this very simple process, SaverXware will automatically recalculate and present a Summary PSD Profile based upon the 720 events from the 4 days of interest, providing a representative vibration summary of that specific distribution segment.
For questions, or more information as to how to use SaverXware’s summary selection utilities, please feel free to contact me directly!